Ricky Nolasco's performance with the Minnesota Twins has been a disappointment. He was signed into a large 4-year contract after the 2013 season to be the Twins' Ace, a destiny he has yet to fulfill. There has been discussion this Spring that despite that contract, Nolasco would have to earn a position in the 2016 Twins' rotation, and hints that at this point, he might be outside, looking in. A couple of days ago, there were indications that he might not want to accept this, and the Twins' blogosphere and fan forums erupted. I am not going to discuss this particular event at this point, other than say that it is not anything new. For example, last season Mike Pelfrey did not take his demotion to the pen lightly, and back in the day, current Twins' closer Glen Perkins filed a Union grievance against the Twins for being demoted. Nolasco's situation is not a done deal. Yet. I think that it is really important to look at his performance, potential root causes for the drop and whether there is hope for Nolasco being an effective starter for the Twins. I will attempt to do this by examining several metrics, and look at raw numbers and data about his pitches.
A few years ago (2011) there was an excellent article about Nolasco, by Vince Caramela at The Hardball Times, titled Ricky Nolasco and the Disappearing Curveball. He looked at Nolasco's pitch selection from 2008 to 2010 and concluded that Nolasco does not throw his curveball enough and has replaced it with a slider, which is not as good. Let's take this as a starting point and look at Nolasco's pitch usage in his whole career from 2006-2015.
Very Important Note (and this stands for this whole article) : 2007 and 2015 data are based on 21.3 and 37.3 innings pitched only, so they might not be significant. Here is Nolasco's % of each pitch:
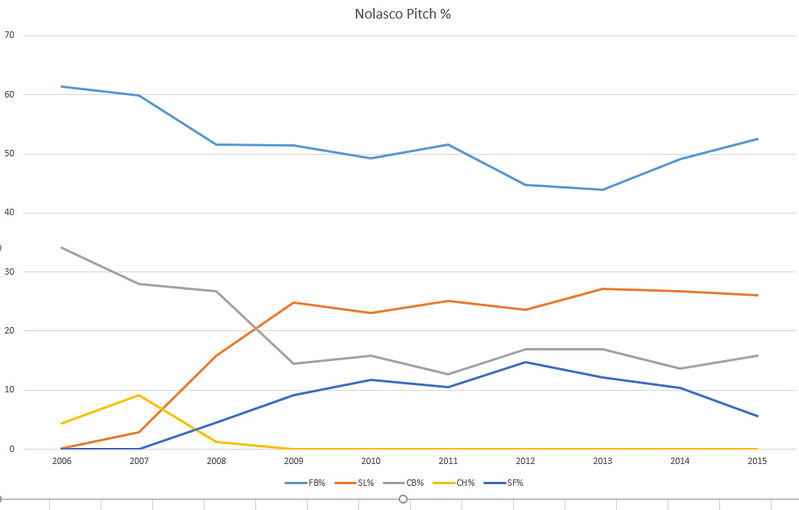
Clearly Nolasco decreased the use of his curve and started to replace some of its use with a slider beginning in 2008. The year before, he replaced a change up with a split finger fastball. How does this correlate with results? Let's superimpose ERA+ and FIP+ on this graph to see any trends. FIP+? Is there such a beast. I needed something analogous to ERA+ (higher is better), so I used FIP- (lower is better from Fangraphs) and took its mirror image around 100 (ie. 90 FIP- became 110 FIP+). Here is the data:
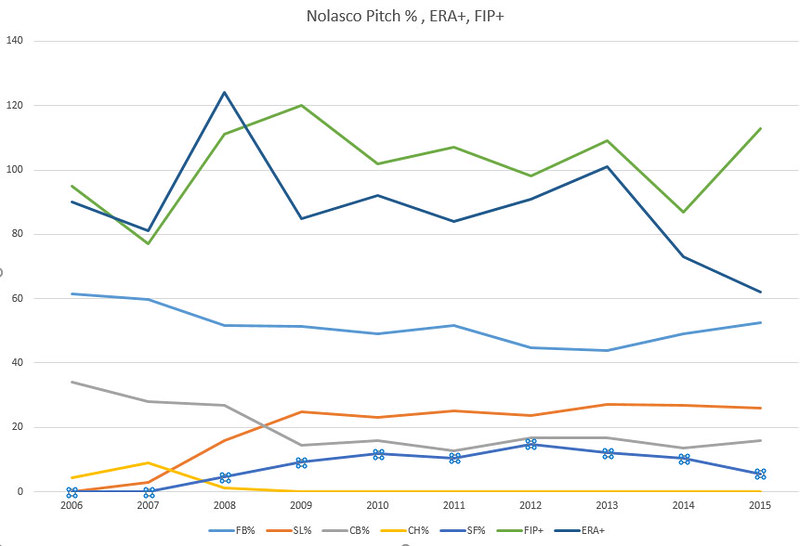
As you can see there is not much correlation of ERA+ (blue) and FIP+ (green) with any individual pitch use and potential replacement of curveball with the slider. If anything, the peaks in ERA+ and FIP+ are in 2008 and 2009, the years he started throwing that slider more and more. Ok. This theory does not seem very true. How about contact? Here is Contanct% off Nolasco in the years with ERA+ and FIP+
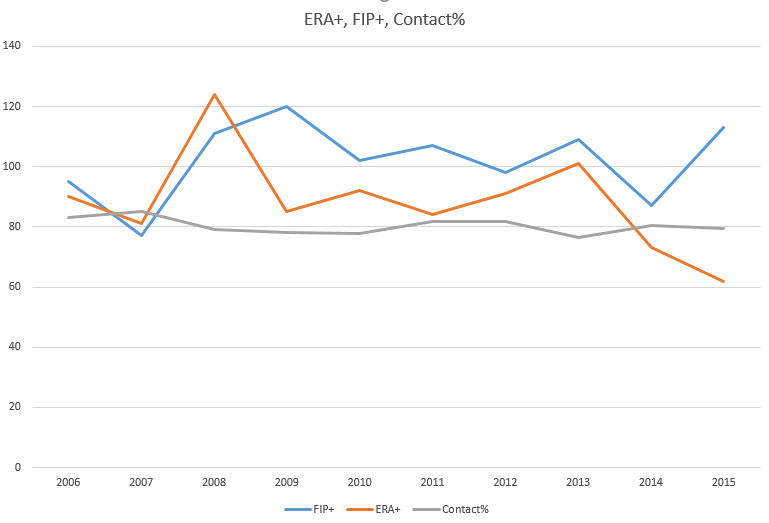
No. Nothing there. Contact% has been practically flat, and withing the standard deviation his whole career. How about better contact or more contact or batting average in balls in play (BABIP?) But this is luck. Then how about percent of runners left on base, which also is luck. %LOB fits this scale, but I had to normalize BABIP to something that looks like this (higher more favorable and around 100) so I created something I call BABIP+ : I took BABIP and multiplied by 300 (so it is around 100), but this would make higher less favorable, so this is more like BABIP-, so I did its mirror image around 100, and call it BABIP+. Here we go:
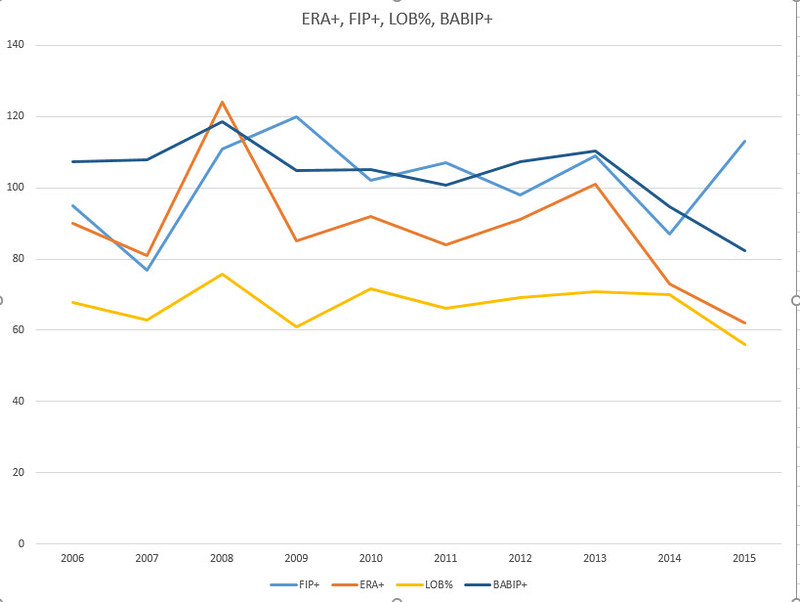
As you can see we are getting somewhere. Both Left on Base and BABIP correlate nicely with ERA+ (orange), but not with FIP+ (lighter blue). So why don't we call the beast by its name and make a single metric out of LOB% and BABIP to represent it and see how it correlates with ERA+
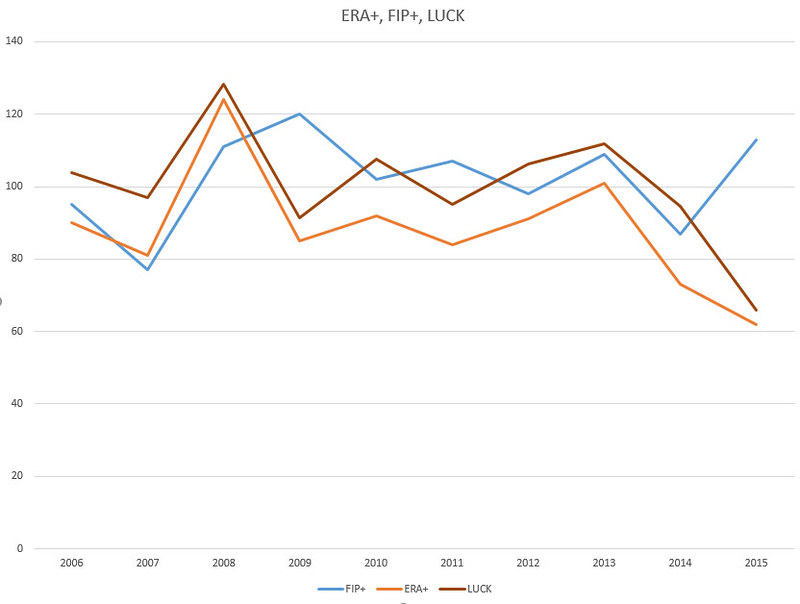
Here we have it. Almost perfect correlation of ERA+ with LUCK. And LUCK is LOB% times BABIP+ and divided by 70 to fit in the scale. So we confirmed what we always knew: ERA and his derivatives, like ERA+, have a lot of random causes, especially things outside of the control of the pitcher such as BABIP, LOB% etc (I could have used HR/FB here, too, but there is no point.)
So the major reason for Nolasco's performance as measured by ERA+ (and ERA) was luck.
How about FIP-based performance, which would actually more importantly tell us what the Twins may expect. Is there anything that correlates well with FIP. Clearly, there is a decline in FIP+ after 2009, with a few peaks, but the moving average is there. There seem to be a couple of things. Enter mystery measurement:
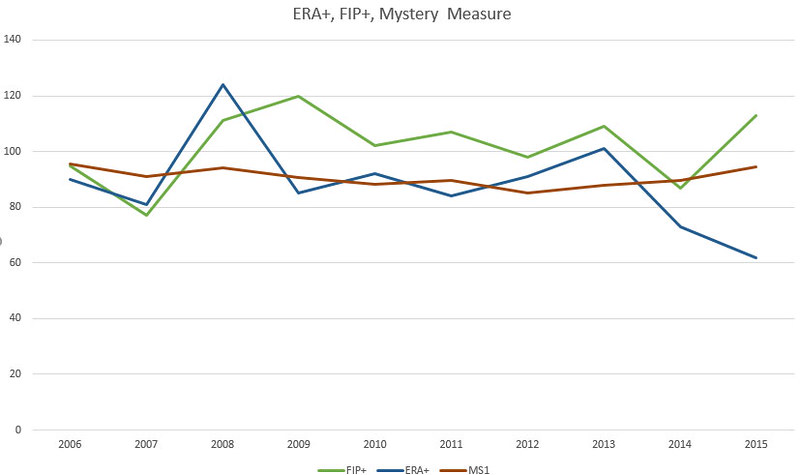
Ignore the ERA+ blue line here. We are done with that. This mystery measurement (burgundy) nicely approximates a FIP+ tendency. You can clearly see the peaks in 2008, 2011, 2013 and 2015 and the valleys in 2010 and 2012, but it is much smoother than FIP+. It more like a running average, which could be a very good leading indicator. What is Mystery Measure? Something very simple and has to do with Nolasco's pitch selection: It is the number of his pitches that were not changeups (a pitch he is not throwing any more) or split fingers, a pitch he has been throwing about 10% of the time as his off-speed pitch. If you look at Fangraphs pitch values, this pitch has been below average and ineffective the last 3 seasons.
So one of the reasons that Nolasco has has bad years as measured by FIP+, is that his split finger fastball is not a good pitch for him. Abandoning it and maybe replacing it with his curveball, will help him in the future. But how much? FIP is better than ERA, but FIP is not perfect either and the reasons are stated here. My preferred tools in looking at pitcher performance are SIERA, which is also explained in the previous link, and it is a measure close to ERA and FIP scale and direction (lees is better) and PE and xPE, which I devised and are on a different scale and the opposite direction. Bigger is better. They are quickly derived, unlike SIERA, and have a great correlation to SIERA, which makes them easy to use. Here is Nolasco's career performance described by PE and xPE (xPE normalizes PE for league average BABIP, so it is more of a predictive tool than PE). The xPE and PE scale is as follows for starters:
35+ Ace
25+ number 1 or 2
15+ number 2 or 3
10+ number 4 or 5
7.5+ number 5
<7 .5="" level="" p="" replacement="">
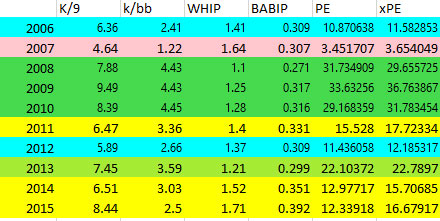
Clearly based on PE and xPE (and ERA+ and FIP+ before it, but not as obvious) Nolasco had a career peak from 2008-2010 when he was a top of the rotation starter, and declined afterwards. There was an outlier hickup in 2013, which showed potential for a number 2 (or 3) starter and that was not realized?
So I am afraid that the 33 year old Nolasco is in the declining phase of his career reaching his peak at ages 26-28. Here is some additional proof: We are looking at his fastball and slider velocities through his career:
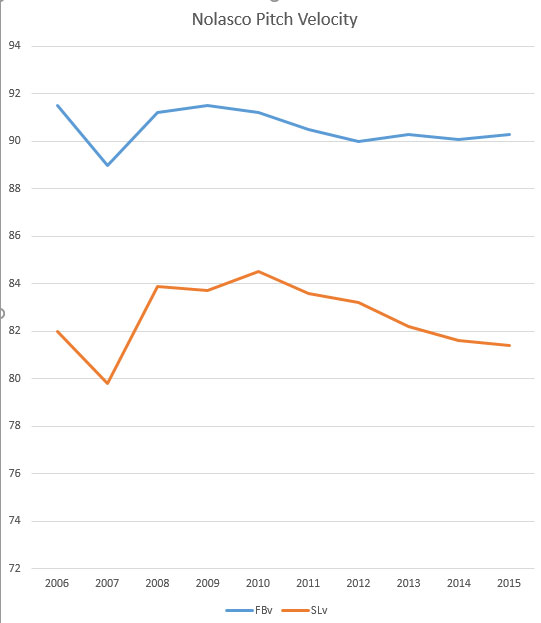
As you can see the velocities of the fastball, and especially the slider have been declining. The slope of the decline in the Slider velocity is fascinating so I did this plot:
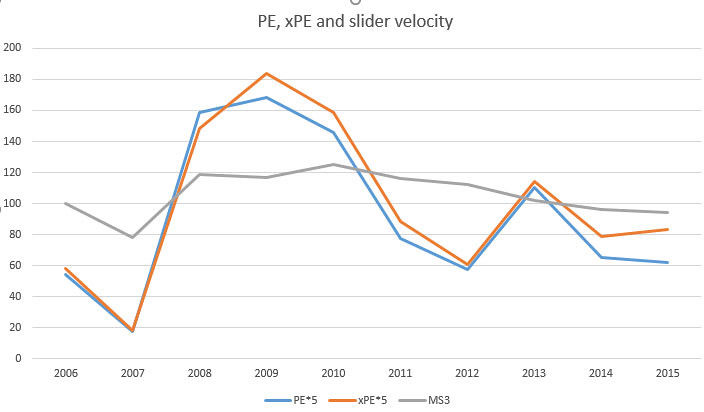
What you see is PE and xPE (both multiplied by 5 for scale) and normalized slider velocity when 2006 is 100. PE and xPE really show clearly Nolasco's career bell curve, with the 2013 aberration, and unlike FIP, do not like his small sample 2016 either. The normalized slider velocity clearly approximates the drop.
So additional explanations for Nolasco's performance is that he is in his declining years and his slider is not what used to be. For what is worth, Fangraphs pitch values, shows a considerable effectiveness of his slider in 2013, which definitely explains the bump in performance.
In summary: Nolasco has been unlucky. However, he is in the declining phase of his career, is a pitcher who lives and dies with his breaking stuff, because his fastball is an average pitch and his slit finger a bad pitch. As his breaking stuff go, so does Nolasco. He could be better in 2016 if:
a. Luck is on his side
b. His breaking stuff improves (if there were injury considerations) or no further declines
c. He stops throwing his split finger fastball and uses his curve as a change of pace pitch
You cannot determine A. B will be a good leading indicator even in Spring Training and C. is totally up to him and his coaches and it is an easy fix.
A few years ago (2011) there was an excellent article about Nolasco, by Vince Caramela at The Hardball Times, titled Ricky Nolasco and the Disappearing Curveball. He looked at Nolasco's pitch selection from 2008 to 2010 and concluded that Nolasco does not throw his curveball enough and has replaced it with a slider, which is not as good. Let's take this as a starting point and look at Nolasco's pitch usage in his whole career from 2006-2015.
Very Important Note (and this stands for this whole article) : 2007 and 2015 data are based on 21.3 and 37.3 innings pitched only, so they might not be significant. Here is Nolasco's % of each pitch:
Clearly Nolasco decreased the use of his curve and started to replace some of its use with a slider beginning in 2008. The year before, he replaced a change up with a split finger fastball. How does this correlate with results? Let's superimpose ERA+ and FIP+ on this graph to see any trends. FIP+? Is there such a beast. I needed something analogous to ERA+ (higher is better), so I used FIP- (lower is better from Fangraphs) and took its mirror image around 100 (ie. 90 FIP- became 110 FIP+). Here is the data:
As you can see there is not much correlation of ERA+ (blue) and FIP+ (green) with any individual pitch use and potential replacement of curveball with the slider. If anything, the peaks in ERA+ and FIP+ are in 2008 and 2009, the years he started throwing that slider more and more. Ok. This theory does not seem very true. How about contact? Here is Contanct% off Nolasco in the years with ERA+ and FIP+
No. Nothing there. Contact% has been practically flat, and withing the standard deviation his whole career. How about better contact or more contact or batting average in balls in play (BABIP?) But this is luck. Then how about percent of runners left on base, which also is luck. %LOB fits this scale, but I had to normalize BABIP to something that looks like this (higher more favorable and around 100) so I created something I call BABIP+ : I took BABIP and multiplied by 300 (so it is around 100), but this would make higher less favorable, so this is more like BABIP-, so I did its mirror image around 100, and call it BABIP+. Here we go:
As you can see we are getting somewhere. Both Left on Base and BABIP correlate nicely with ERA+ (orange), but not with FIP+ (lighter blue). So why don't we call the beast by its name and make a single metric out of LOB% and BABIP to represent it and see how it correlates with ERA+
Here we have it. Almost perfect correlation of ERA+ with LUCK. And LUCK is LOB% times BABIP+ and divided by 70 to fit in the scale. So we confirmed what we always knew: ERA and his derivatives, like ERA+, have a lot of random causes, especially things outside of the control of the pitcher such as BABIP, LOB% etc (I could have used HR/FB here, too, but there is no point.)
So the major reason for Nolasco's performance as measured by ERA+ (and ERA) was luck.
How about FIP-based performance, which would actually more importantly tell us what the Twins may expect. Is there anything that correlates well with FIP. Clearly, there is a decline in FIP+ after 2009, with a few peaks, but the moving average is there. There seem to be a couple of things. Enter mystery measurement:
Ignore the ERA+ blue line here. We are done with that. This mystery measurement (burgundy) nicely approximates a FIP+ tendency. You can clearly see the peaks in 2008, 2011, 2013 and 2015 and the valleys in 2010 and 2012, but it is much smoother than FIP+. It more like a running average, which could be a very good leading indicator. What is Mystery Measure? Something very simple and has to do with Nolasco's pitch selection: It is the number of his pitches that were not changeups (a pitch he is not throwing any more) or split fingers, a pitch he has been throwing about 10% of the time as his off-speed pitch. If you look at Fangraphs pitch values, this pitch has been below average and ineffective the last 3 seasons.
So one of the reasons that Nolasco has has bad years as measured by FIP+, is that his split finger fastball is not a good pitch for him. Abandoning it and maybe replacing it with his curveball, will help him in the future. But how much? FIP is better than ERA, but FIP is not perfect either and the reasons are stated here. My preferred tools in looking at pitcher performance are SIERA, which is also explained in the previous link, and it is a measure close to ERA and FIP scale and direction (lees is better) and PE and xPE, which I devised and are on a different scale and the opposite direction. Bigger is better. They are quickly derived, unlike SIERA, and have a great correlation to SIERA, which makes them easy to use. Here is Nolasco's career performance described by PE and xPE (xPE normalizes PE for league average BABIP, so it is more of a predictive tool than PE). The xPE and PE scale is as follows for starters:
35+ Ace
25+ number 1 or 2
15+ number 2 or 3
10+ number 4 or 5
7.5+ number 5
<7 .5="" level="" p="" replacement="">
Clearly based on PE and xPE (and ERA+ and FIP+ before it, but not as obvious) Nolasco had a career peak from 2008-2010 when he was a top of the rotation starter, and declined afterwards. There was an outlier hickup in 2013, which showed potential for a number 2 (or 3) starter and that was not realized?
So I am afraid that the 33 year old Nolasco is in the declining phase of his career reaching his peak at ages 26-28. Here is some additional proof: We are looking at his fastball and slider velocities through his career:
As you can see the velocities of the fastball, and especially the slider have been declining. The slope of the decline in the Slider velocity is fascinating so I did this plot:
What you see is PE and xPE (both multiplied by 5 for scale) and normalized slider velocity when 2006 is 100. PE and xPE really show clearly Nolasco's career bell curve, with the 2013 aberration, and unlike FIP, do not like his small sample 2016 either. The normalized slider velocity clearly approximates the drop.
So additional explanations for Nolasco's performance is that he is in his declining years and his slider is not what used to be. For what is worth, Fangraphs pitch values, shows a considerable effectiveness of his slider in 2013, which definitely explains the bump in performance.
In summary: Nolasco has been unlucky. However, he is in the declining phase of his career, is a pitcher who lives and dies with his breaking stuff, because his fastball is an average pitch and his slit finger a bad pitch. As his breaking stuff go, so does Nolasco. He could be better in 2016 if:
a. Luck is on his side
b. His breaking stuff improves (if there were injury considerations) or no further declines
c. He stops throwing his split finger fastball and uses his curve as a change of pace pitch
You cannot determine A. B will be a good leading indicator even in Spring Training and C. is totally up to him and his coaches and it is an easy fix.