The art of evaluating performance inside a baseball diamond has undoubtedly changed the last few years with the infusion of science (math & statistic notations.) In the "good old days" if someone "hit 300", with more than 30 home runs and either more than 100 runs scored or 100 "ribies", he had a great season. That was the measuring stick that separated great from very good. And it still does, mainly on the mainstream press, game broadcasts and talk radio. The expressions "he hits two seventy five" and "he cannot hit his weight" will be there as performance measures, albeit as crude as an Amish scooter is for propelling devise when compared to a Tesla . Still, even that is light years ahead than the Fred Flintstone mobile of a hitter's performance evaluation, the "eyeballing" method, which introduces measures such as "the special sound a ball makes when leaves the bat" or "the quickness of someone's wrists" or the way "someone is flying on the bases" or something.
There has been evolution. OPS as a concept was introduced in 1984, and then was refined to OPS+ or adjusted OPS, that normalizes for park and league effects, plus adds an easy to compare baseline of 100 that is the league average that season, for an easy reference. So an OPS+ higher than 100 is better than average and less than 100 worse. Much improved from "ribies" and other cumulative stats, but still one dimensional Gremlin-like. What OPS lacks, is that it disregards the ability of someone to sacrifice runs, steal bases, score runs, avoid hitting into double plays, and all the other goodies that are happening in real life baseball with the bat or at the bases.
A year after OPS was created, in 1985, Bill James introduced a measure for offensive performance he called Runs Created . This concept has been improved (see previous reference) constantly to account for things like stolen bases and sacrifices. Tom Tango, eventually improved the concept or Runs Created and morphed it into weighted Runs Created or wRC. wRC is a good way of looking at someones performance, but (like RC) it is cumulative; think Runs, HRs and RBIs. This is fine for evaluating a season (like who had the best season in an MVP type of consideration) or whether someone's career is HOF worthy (both cummulative questions; for the record I do prefer WAR over wRC to answer those, since it includes fielding, among other reasons); however it does not answer the question of who performed the best for the time he was on the field (and maybe play him more, or call him "up", if necessary.)
So we moved from a Gremin to a 'cuda (Yes, I like 'cudas too, especially the Hemi version, but they are not without faults) Enter wRC+ to the equation. wRC+ is a lot like OPS+. It is based on wRC (runs created with the bat and on the bases, independent of league and park,) but it normalized to 100 (denoting league average, like OPS+,) and furthermore it is a rate metric (think UZR/120 vs UZR) so you can look at chunks of performance, moving plate appearance variations (sample size) aside. A good writeup in basic terms about wRC+ is found here: This interesting article from Denver Post (an enlightened mainstream newspaper), uses wRC+ to argue the greatness of Carlos Gonzalez.
Here is a real life field test of the effectiveness of cumulative measures like wRC (and WAR) compared to rate stats, like wRC+. Work with me: Let's rewind to the Twins' last good season (2010) and ask the question: who was the best Twins' player on the field (for the time he played, assuming that it was significant; I like the 200 PA mark as a cut-off point) and try to find an objective quantitative measure to support your argument. "Ribies" and ball sounds and the like are not allowed.
Here are the top 6 in wRC, a cumulative measure, with Plate Appearances (and OPS for reference) in parenthesis, in descending order.
Joe Mauer 93 (584, .871)
Delmon Young 87 (613, .826)
Michael Cuddyer 82 (675, .753)
Justin Morneau 75 (348, 1.055)
Denard Span 73 (705, .679)
Jim Thome 71 (340, 1.039)
So basically, the cummulative stat, because of the disparity of sample size favors an average player (Cuddyer) and a below average player (Span) because they had twice as many PAs as Morneau and Thome; the "longevity" effect in HOF discussions.
Let's look at the best wRC+ with a 200 PA minimum (to filter players like Luke Hughes and Carl Pavano who make the list but had less than 10 PAs) :
Justin Morneau 184
Jim Thome 178
Joe Mauer 136
Delmon Young 120
(Danny Valencia 118)
Michael Cuddyer 104
.
.
.
(4 players)
Denard Span 88
This is what wRC+ does. And this was the season that every single Twins' fan was saying what that season would have been, "if" Morneau did not hit his head. I hope this little example illustrates the value of wRC+ vs things like wRC and WAR.
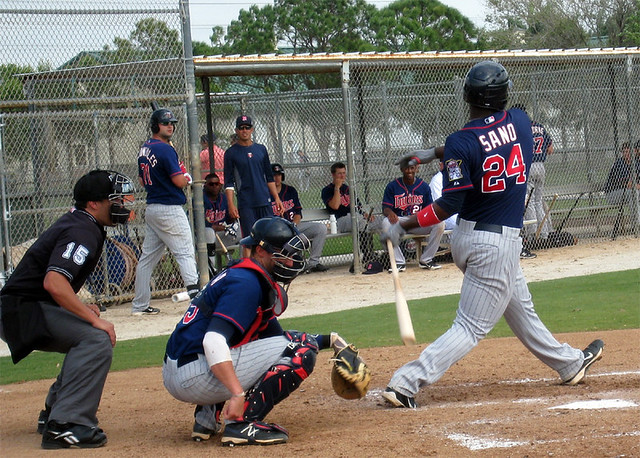
After the long but necessary introduction, back to the original subject, Miquel Sano. If trying to find objective measures that evaluate performance on the field is difficult, finding objective quantitative measures that can estimate future performance, used to discuss who is the best prospect or to create prospect "lists" is borderline impossible (like trying to create a vehicle that is using air for fuel and emits water for exhaust.) But we can dream and play. Earlier this year, during the off-season, I looked at potential future performance of the starting pitchers in the Twins' organization using objective quantitative measures. I will repeat the exercise this coming off-season looking at the position players and the whole slew of pitchers and not only starters. I will be using wRC+ as the basis of that endeavor, based on the discussion above. In addition, age and level of play will also be major factors. But for this piece here, before it turns into War and Peace, let's focus on Miguel Sano's performance this season in a quantitative way and putting it in perspective:
Miguel Sano in 243 PAs in A+ (average league age for hitters is 23) at age 20 had a 201 wRC+. In 190 PAs in AA(average league age for hitters is 24.5) at age 20 he is having a 158 wRC+. His AA numbers are in flex and we can discuss more after the season is over, but his A+ number are final. To put that 201 wRC+ in perspective:
- It is the highest in the minors this season (second highest is Chris Colabello with 197 in Rochester, who is well in his prime and older than the average AAA player)
- It has been achieved by only 5 major leaguers in the past 30 years (mininum 200 PAs): Miguel Cabrera, Barry Bonds, Mark McGwire, Jeff Bagwell, Frank Thomas; and Cabrera's is this season, so it is not final.
For the fun of it, and the perspective of Sano's dominance, here is a list of all the MLB leaders in wRC+ (and some close to the leaders) with career highs indicated for the last 30 seasons:
2013: Miguel Cabrera, 210, in progress
2012: Mike Trout & Miguel Cabrera tied, 166
2011: Jose Bautista, 180 (career high)
2010: Josh Hamilton, 175 (career high)
2009: Albert Pujols, 180 ; Joe Mauer, 170 (career high)
2008: Albert Pujols, 184 (career high)
2007: David Ortiz & Alex Rodriguez tied, 175 (career high for both)
2006: Travis Hafner, 176 (career high)
2005: Alex Rodriguez, 174
2004: Barry Bonds, 233 (Todd Helton, 166, career high)
2003: Barry Bonds, 212 (Albert Pujols, 184)
2002: Barry Bonds, 244 (Jim Thome 189, Manny Ramirez 185); all three career high
2001: Barry Bonds, 235 (Jason Giambi 193, Sammy Sosa 186; career high for both);
2000: Manny Ramirez, 181
1999: Manny Ramirez, 172 (Mark McGwire, 168)
1998: Mark McGwire, 205 (career high)
1997: Mike Piazza, 183, career high (Frank Thomas, 179, Larry Walker 177, career high)
1996: Mark McGwire, 190 (Garry Sheffield 185, career high)
1995: Edgar Martinez, 182 (career high)
1994: Frank Thomas & Jeff Bagwell, 205 (Albert Belle 186); all three career high
1993: Barry Bonds, 193
1992: Barry Bonds, 198
1991: Frank Thomas, 179 (Chili Davis, 139)
1990: Rickey Henderson, 190 (career high)
1989: Kevin Mitchell, 184 (career high)
1988: Jose Canseco, 169 (career high)
1987: Jack Clark 176, Wade Boggs 171; both career high (Kent Hrbek, 134)
1986: Don Mattingly 160 (career high)
1985: Pedro Guerrero 181 (George Brett 168); both career high
1984: Mike Schmidt 154 (career high)
1983: Wade Boggs 155
And here are the wRC+ career highs and career averages for selected Twins' hitters
Harmon Killebrew, high: 176, 1967; career average: 142
Tony Oliva, high: 154, 1971; career average: 129
Rod Carew, high: 175, 1977; career average: 132
Kent Hrbek: high: 146, 1988 career average: 126
Kirby Puckett: high: 150, 1988 career average: 122
Dave Winfield: high: 161, 1975; career average: 128
Paul Molitor: high: 145 1991; career average: 122
Joe Mauer: high: 170, 2009; career average: 133
Justin Morneau: high: 184, 2010; career average: 118
Sano's career worst wRC+ is 146 last season in Beloit. As you can see, his wRC+ numbers this season, in combination with his age, his level of play and the average age in that level, are totally out of the stratosphere.
How about Byron Buxton? Buxton is only 7 months younger than Sano, and has been playing at a full level below Sano. So the age/level combination is very similar (but still on Sano's favor).
Here are Buxton numbers: in 321 PAs in A (average league age for hitters is 21.5) at age 19 had a 173 wRC+. In 174 PAs in A+ at age 19 (average league age for hitters is 23) he is having a 129 wRC+. For comparison's sake, the Angels' Mike Trout, at the same age (19), at the same league (Midwest), at the same team (Cedar Rapids) had an identical 173 wRC+. Objectively, Byron Buxton, looks like he is the prospect Mike Trout was and had a great season in Cedar Rapids (and this is great news for the Twins), but Sano had a monumental season in Fort Meyers. Better than Morneau's 2010 with the Twins. I just cannot see how objectively anyone can justify ranking Buxton higher than Sano, or not rank Sano as the number one prospect in baseball this season; unless it is the sound the ball makes when it meets his bat (or something)
Sano is poised to be a centerpiece in the majors for years to come. Fans will enjoy seeing his #PowerBananas for a long while. I just hope that they are all with him in a Twins' uniform...

There has been evolution. OPS as a concept was introduced in 1984, and then was refined to OPS+ or adjusted OPS, that normalizes for park and league effects, plus adds an easy to compare baseline of 100 that is the league average that season, for an easy reference. So an OPS+ higher than 100 is better than average and less than 100 worse. Much improved from "ribies" and other cumulative stats, but still one dimensional Gremlin-like. What OPS lacks, is that it disregards the ability of someone to sacrifice runs, steal bases, score runs, avoid hitting into double plays, and all the other goodies that are happening in real life baseball with the bat or at the bases.
A year after OPS was created, in 1985, Bill James introduced a measure for offensive performance he called Runs Created . This concept has been improved (see previous reference) constantly to account for things like stolen bases and sacrifices. Tom Tango, eventually improved the concept or Runs Created and morphed it into weighted Runs Created or wRC. wRC is a good way of looking at someones performance, but (like RC) it is cumulative; think Runs, HRs and RBIs. This is fine for evaluating a season (like who had the best season in an MVP type of consideration) or whether someone's career is HOF worthy (both cummulative questions; for the record I do prefer WAR over wRC to answer those, since it includes fielding, among other reasons); however it does not answer the question of who performed the best for the time he was on the field (and maybe play him more, or call him "up", if necessary.)
So we moved from a Gremin to a 'cuda (Yes, I like 'cudas too, especially the Hemi version, but they are not without faults) Enter wRC+ to the equation. wRC+ is a lot like OPS+. It is based on wRC (runs created with the bat and on the bases, independent of league and park,) but it normalized to 100 (denoting league average, like OPS+,) and furthermore it is a rate metric (think UZR/120 vs UZR) so you can look at chunks of performance, moving plate appearance variations (sample size) aside. A good writeup in basic terms about wRC+ is found here: This interesting article from Denver Post (an enlightened mainstream newspaper), uses wRC+ to argue the greatness of Carlos Gonzalez.
Here is a real life field test of the effectiveness of cumulative measures like wRC (and WAR) compared to rate stats, like wRC+. Work with me: Let's rewind to the Twins' last good season (2010) and ask the question: who was the best Twins' player on the field (for the time he played, assuming that it was significant; I like the 200 PA mark as a cut-off point) and try to find an objective quantitative measure to support your argument. "Ribies" and ball sounds and the like are not allowed.
Here are the top 6 in wRC, a cumulative measure, with Plate Appearances (and OPS for reference) in parenthesis, in descending order.
Joe Mauer 93 (584, .871)
Delmon Young 87 (613, .826)
Michael Cuddyer 82 (675, .753)
Justin Morneau 75 (348, 1.055)
Denard Span 73 (705, .679)
Jim Thome 71 (340, 1.039)
So basically, the cummulative stat, because of the disparity of sample size favors an average player (Cuddyer) and a below average player (Span) because they had twice as many PAs as Morneau and Thome; the "longevity" effect in HOF discussions.
Let's look at the best wRC+ with a 200 PA minimum (to filter players like Luke Hughes and Carl Pavano who make the list but had less than 10 PAs) :
Justin Morneau 184
Jim Thome 178
Joe Mauer 136
Delmon Young 120
(Danny Valencia 118)
Michael Cuddyer 104
.
.
.
(4 players)
Denard Span 88
This is what wRC+ does. And this was the season that every single Twins' fan was saying what that season would have been, "if" Morneau did not hit his head. I hope this little example illustrates the value of wRC+ vs things like wRC and WAR.
After the long but necessary introduction, back to the original subject, Miquel Sano. If trying to find objective measures that evaluate performance on the field is difficult, finding objective quantitative measures that can estimate future performance, used to discuss who is the best prospect or to create prospect "lists" is borderline impossible (like trying to create a vehicle that is using air for fuel and emits water for exhaust.) But we can dream and play. Earlier this year, during the off-season, I looked at potential future performance of the starting pitchers in the Twins' organization using objective quantitative measures. I will repeat the exercise this coming off-season looking at the position players and the whole slew of pitchers and not only starters. I will be using wRC+ as the basis of that endeavor, based on the discussion above. In addition, age and level of play will also be major factors. But for this piece here, before it turns into War and Peace, let's focus on Miguel Sano's performance this season in a quantitative way and putting it in perspective:
Miguel Sano in 243 PAs in A+ (average league age for hitters is 23) at age 20 had a 201 wRC+. In 190 PAs in AA(average league age for hitters is 24.5) at age 20 he is having a 158 wRC+. His AA numbers are in flex and we can discuss more after the season is over, but his A+ number are final. To put that 201 wRC+ in perspective:
- It is the highest in the minors this season (second highest is Chris Colabello with 197 in Rochester, who is well in his prime and older than the average AAA player)
- It has been achieved by only 5 major leaguers in the past 30 years (mininum 200 PAs): Miguel Cabrera, Barry Bonds, Mark McGwire, Jeff Bagwell, Frank Thomas; and Cabrera's is this season, so it is not final.
For the fun of it, and the perspective of Sano's dominance, here is a list of all the MLB leaders in wRC+ (and some close to the leaders) with career highs indicated for the last 30 seasons:
2013: Miguel Cabrera, 210, in progress
2012: Mike Trout & Miguel Cabrera tied, 166
2011: Jose Bautista, 180 (career high)
2010: Josh Hamilton, 175 (career high)
2009: Albert Pujols, 180 ; Joe Mauer, 170 (career high)
2008: Albert Pujols, 184 (career high)
2007: David Ortiz & Alex Rodriguez tied, 175 (career high for both)
2006: Travis Hafner, 176 (career high)
2005: Alex Rodriguez, 174
2004: Barry Bonds, 233 (Todd Helton, 166, career high)
2003: Barry Bonds, 212 (Albert Pujols, 184)
2002: Barry Bonds, 244 (Jim Thome 189, Manny Ramirez 185); all three career high
2001: Barry Bonds, 235 (Jason Giambi 193, Sammy Sosa 186; career high for both);
2000: Manny Ramirez, 181
1999: Manny Ramirez, 172 (Mark McGwire, 168)
1998: Mark McGwire, 205 (career high)
1997: Mike Piazza, 183, career high (Frank Thomas, 179, Larry Walker 177, career high)
1996: Mark McGwire, 190 (Garry Sheffield 185, career high)
1995: Edgar Martinez, 182 (career high)
1994: Frank Thomas & Jeff Bagwell, 205 (Albert Belle 186); all three career high
1993: Barry Bonds, 193
1992: Barry Bonds, 198
1991: Frank Thomas, 179 (Chili Davis, 139)
1990: Rickey Henderson, 190 (career high)
1989: Kevin Mitchell, 184 (career high)
1988: Jose Canseco, 169 (career high)
1987: Jack Clark 176, Wade Boggs 171; both career high (Kent Hrbek, 134)
1986: Don Mattingly 160 (career high)
1985: Pedro Guerrero 181 (George Brett 168); both career high
1984: Mike Schmidt 154 (career high)
1983: Wade Boggs 155
And here are the wRC+ career highs and career averages for selected Twins' hitters
Harmon Killebrew, high: 176, 1967; career average: 142
Tony Oliva, high: 154, 1971; career average: 129
Rod Carew, high: 175, 1977; career average: 132
Kent Hrbek: high: 146, 1988 career average: 126
Kirby Puckett: high: 150, 1988 career average: 122
Dave Winfield: high: 161, 1975; career average: 128
Paul Molitor: high: 145 1991; career average: 122
Joe Mauer: high: 170, 2009; career average: 133
Justin Morneau: high: 184, 2010; career average: 118
Sano's career worst wRC+ is 146 last season in Beloit. As you can see, his wRC+ numbers this season, in combination with his age, his level of play and the average age in that level, are totally out of the stratosphere.
How about Byron Buxton? Buxton is only 7 months younger than Sano, and has been playing at a full level below Sano. So the age/level combination is very similar (but still on Sano's favor).
Here are Buxton numbers: in 321 PAs in A (average league age for hitters is 21.5) at age 19 had a 173 wRC+. In 174 PAs in A+ at age 19 (average league age for hitters is 23) he is having a 129 wRC+. For comparison's sake, the Angels' Mike Trout, at the same age (19), at the same league (Midwest), at the same team (Cedar Rapids) had an identical 173 wRC+. Objectively, Byron Buxton, looks like he is the prospect Mike Trout was and had a great season in Cedar Rapids (and this is great news for the Twins), but Sano had a monumental season in Fort Meyers. Better than Morneau's 2010 with the Twins. I just cannot see how objectively anyone can justify ranking Buxton higher than Sano, or not rank Sano as the number one prospect in baseball this season; unless it is the sound the ball makes when it meets his bat (or something)
Sano is poised to be a centerpiece in the majors for years to come. Fans will enjoy seeing his #PowerBananas for a long while. I just hope that they are all with him in a Twins' uniform...