Showing posts with label 2014 ST Dashboards. Show all posts

3/16/14

The Minnesota Twins cut 8 and the latest Spring Training dashboards

Today the Twins announced 8 cuts from the major league Spring Training camp.

The following players were optioned to AAA Rochester:

C Eric Fryer
LHP Kris Johnson
SS Danny Santana

And the following were re-assigned to the minor league camp:

IF James Beresford
LHP Sean Gilmartin 
OF Darin Mastroianni
OF Jermaine Mitchell
3B/1B Brandon Waring

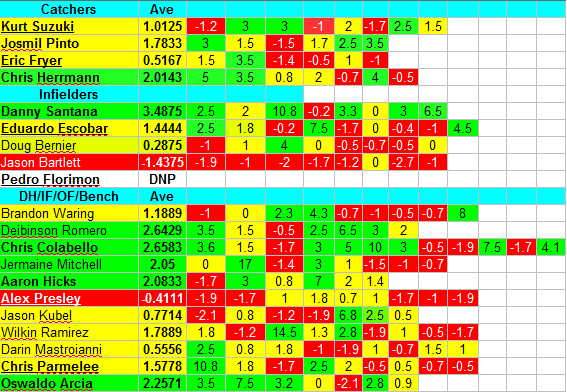
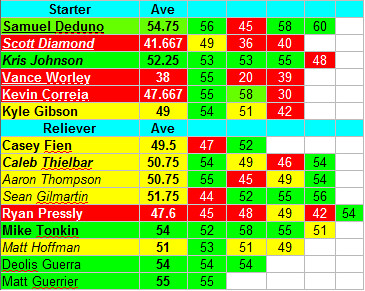
The Santana and Johnson cuts are pretty surprising because they were doing pretty well.  Santana was probably the best position player at the camp and Pedro Florimon could not get the ball out of the cage in batting practice a couple days ago.  It might be good news for Eduardo Escobar.  However, I find it surprising that Doug Bernier, who has been barely average and Jason Bartlett who has been awful, are still in camp.  Kris Johnson's performance was the best of a lefty in the bubble so far, and his cut is also interesting at this point, given the fact that Aaron Thompson (not to mention Scott Diamond) is still in camp.  Maybe  they want to stretch him for starting in AAA.

These cuts leave the Twins with 20 pitchers and 20 position players, which means that 15 more need to be cut before opening day.

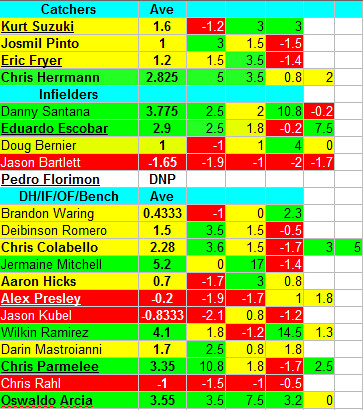
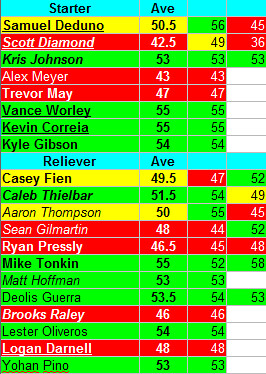
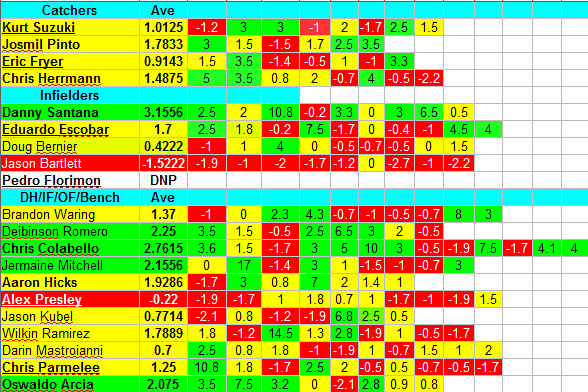
Here are the newest Spring Training Dashboards reflecting last night's game, including the players who were cut:
(You can find all of the 2014 Spring Training dashboards here) :

A reminder of the scoring system:


For the pitchers, I quantify using  a measurement created by Bill James more than a decade ago called "Game Score".  It is calculated as follows:
You start with 50 points for each pitcher.
Add 1 point for each out.
Add 1 point for each strikeout.
Subtract 2 points for each hit.
Subtract 4 points for each earned run.
Subtract 2 points for each unearned run.
Subtract 1 point for each walk.
There is a point bonus for pitching more than 4 innings as well, adding 2 points for each IP after the 4th, but this is not too applicable here.

Game Scored of 49-51 are "average" (yellow),
everything higher than 51 "above average" (green),
and everything below 49 "below average" (red).

For position players, I devised a similar metric that goes like this:
Start with 0 points (unlike the pitching Game Score that starts with 50)
Add 1 point for each Run, RBI, 2B, SB, BB, and HBP recorded.
Add 2.5 for each hit, 3 for each 3B and 4 for each HR.
Subtract 1 for each CS and GIDP,
subtract 1 for each error,
for catchers add 1 for each CS
Subtract 0.2 for each SO and 0.5 for each AB.

Again, as in the Pitching Battle Dashboard, the Position Player Battle Dashboard is color-coded based on average, above average and below average performances, where:

Average is Batting Game Score between 0 and 2
Above average is Batting Game Score higher than 2
Below average is Batting Game Score less than 0

Players on the 40-man roster are in bold.  The ones without options are also underlined.  Left-handed pitchers are in italics.

Here is the Dashboard for the Twins' position players:

And here for the pitchers:
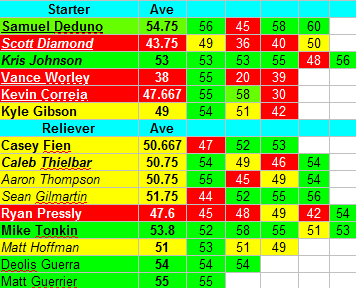


I am heading to Hammond Stadium soon, where the Twins meet Kevin Slowey and the Florida Marlins.

3/14/14

Twins Spring Training Report From Fort Myers: 3/14/2014 and the newest dashboards

Second day of live coverage of the Twins Spring training from Fort Myers.  Today there was mainly major league action and some minor league drills before the Miracle and Kernels games, with the Red Wings and Rock Cats squads traveling.

 As a reminder, you can find all Spring Training coverage here

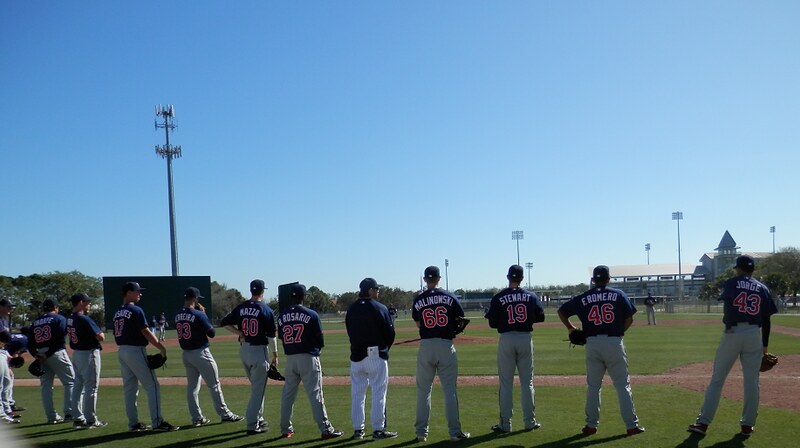
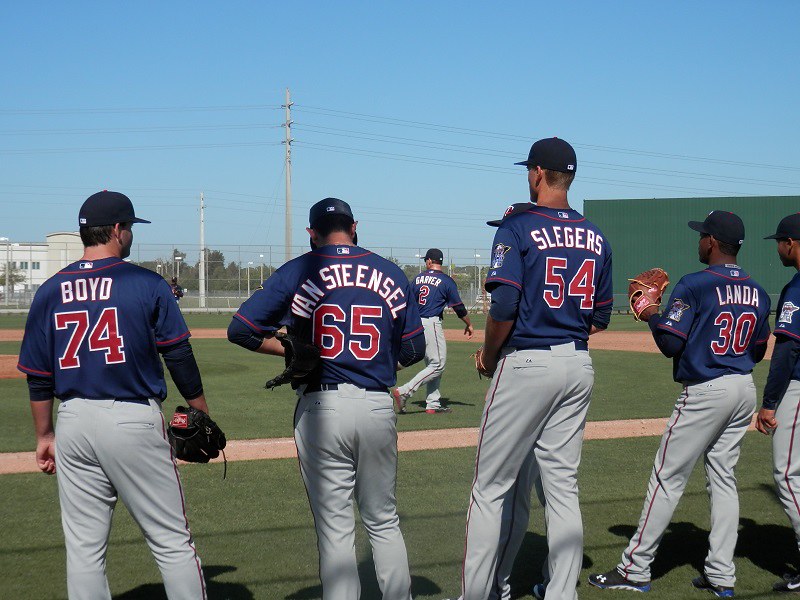
On the single A Beloit side of things, there was a lot of fielding practice going on, including a lot of serious work with the pitchers.  I think that these gentlemen might make a pretty mighty squad this coming season:


On the field few paces west (Field 2) the high A squad was doing drills with Doug Mientkiewitz and company.   This is more of a note to self, but this guy, is one to follow, especially after his lights out appearance at Elizabethton last season.  Second tallest person in the Twins' system (Loek Van Mil now has replaced Tanaka in his previous team in Japan) and I think that his future is bright.


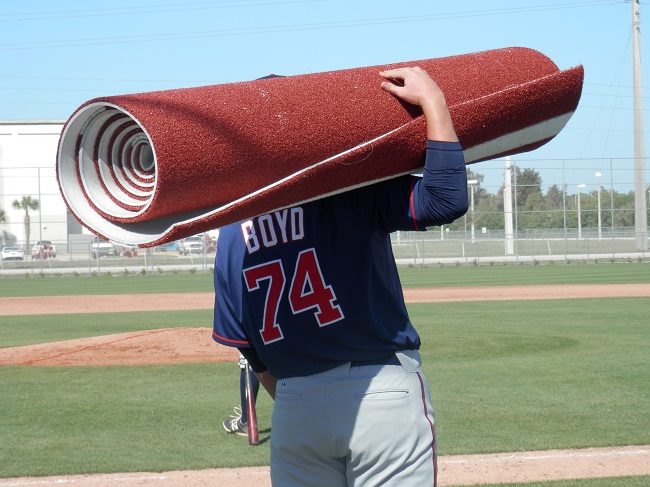
And, yes, Hudson Boyd looks a lot slimmer and he ever volunteer to carry stuff around:


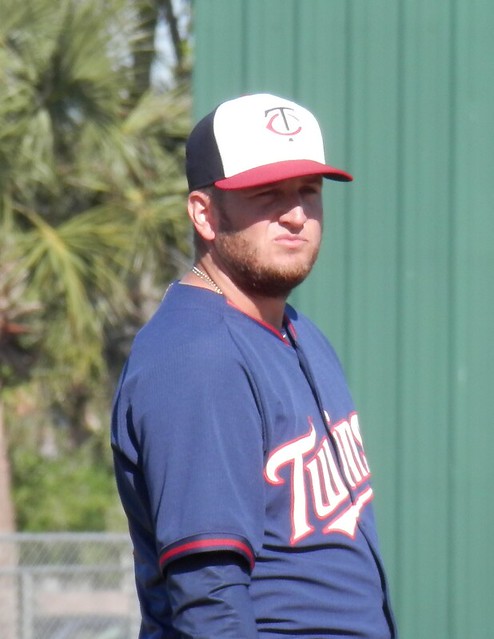
Even this guy was practicing with the Miracle:


And it was good to see him rip a couple and let them go.  (This is Alex Wimmers, if you don't know.)  He then joined a bunch of Red Wings' pitchers like Alex Meyers, Yohan Pino, Danny Turpen and company for a toss.

The main affair at Hammond Stadium was a 2-2 a piece tie with Baltimore.  Mike Pelfrey started and he pitched a fine 3 innings.  A couple things to note (actually one) :  Either he is working on a sinker (yes) or they calibrated the Hammond Stadium radar (yes too).  He was tossing mainly two seamers with a couple of curves and splitters mixed in today and his two-seamers were sitting around 89-91 a good 4-5 mph below his usual four seamer velocity.

Good to see Mattie Guerrier throw today, especially after Jared Burton, because he was so much better than Burton.  Easy 92-93 mph, nice mechanics, I am not sure whether he should be regarded as a dark horse at this point.  Give him a week or so of work and I suspect that he might make the team.

Glen Perkins signed a contact extension and this was what he had to say:


The other half of the Twins' split squad punished the Yankees 7-2 up in Tampa today.  

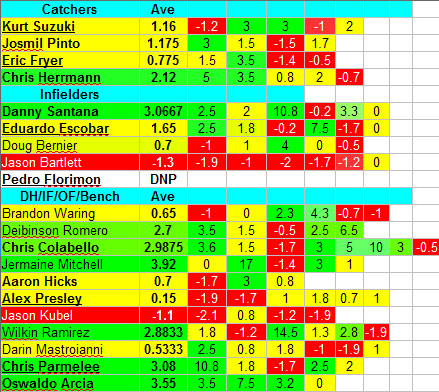
Here are the newest Spring Training Dashboards reflecting both games today:

(You can find all of the 2014 Spring Training dashboards here) :

A reminder of the scoring system:


For the pitchers, I quantify using  a measurement created by Bill James more than a decade ago called "Game Score".  It is calculated as follows:
You start with 50 points for each pitcher.
Add 1 point for each out.
Add 1 point for each strikeout.
Subtract 2 points for each hit.
Subtract 4 points for each earned run.
Subtract 2 points for each unearned run.
Subtract 1 point for each walk.
There is a point bonus for pitching more than 4 innings as well, adding 2 points for each IP after the 4th, but this is not too applicable here.

Game Scored of 49-51 are "average" (yellow),
everything higher than 51 "above average" (green),
and everything below 49 "below average" (red).

For position players, I devised a similar metric that goes like this:
Start with 0 points (unlike the pitching Game Score that starts with 50)
Add 1 point for each Run, RBI, 2B, SB, BB, and HBP recorded.
Add 2.5 for each hit, 3 for each 3B and 4 for each HR.
Subtract 1 for each CS and GIDP,
subtract 1 for each error,
for catchers add 1 for each CS
Subtract 0.2 for each SO and 0.5 for each AB.

Again, as in the Pitching Battle Dashboard, the Position Player Battle Dashboard is color-coded based on average, above average and below average performances, where:

Average is Batting Game Score between 0 and 2
Above average is Batting Game Score higher than 2
Below average is Batting Game Score less than 0

Players on the 40-man roster are in bold.  The ones without options are also underlined.  Left-handed pitchers are in italics.

Here is the Dashboard for the Twins' position players:


 and for the pitchers:


3/10/14

Updated Twins Spring Training Battle Dashboards Reflecting the First Cuts

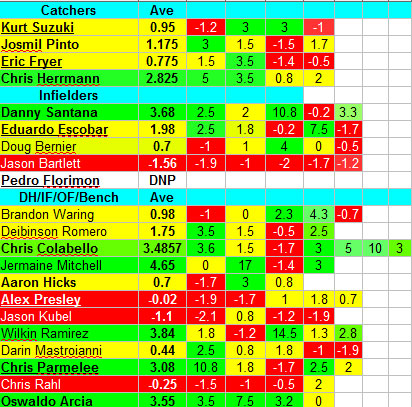
Here are the latest Twins Spring Training battle dashboards updated for yesterday's game and the Spring Training cuts.  The players who were cut are not longer listed.  You can find all of the 2014 Spring Training dashboards here) :

A reminder of the scoring system:


For the pitchers, I quantify using  a measurement created by Bill James more than a decade ago called "Game Score".  It is calculated as follows:
You start with 50 points for each pitcher.
Add 1 point for each out.
Add 1 point for each strikeout.
Subtract 2 points for each hit.
Subtract 4 points for each earned run.
Subtract 2 points for each unearned run.
Subtract 1 point for each walk.
There is a point bonus for pitching more than 4 innings as well, adding 2 points for each IP after the 4th, but this is not too applicable here.

Game Scored of 49-51 are "average" (yellow),
everything higher than 51 "above average" (green),
and everything below 49 "below average" (red).

For position players, I devised a similar metric that goes like this:
Start with 0 points (unlike the pitching Game Score that starts with 50)
Add 1 point for each Run, RBI, 2B, SB, BB, and HBP recorded.
Add 2.5 for each hit, 3 for each 3B and 4 for each HR.
Subtract 1 for each CS and GIDP,
subtract 1 for each error,
for catchers add 1 for each CS
Subtract 0.2 for each SO and 0.5 for each AB.

Again, as in the Pitching Battle Dashboard, the Position Player Battle Dashboard is color-coded based on average, above average and below average performances, where:

Average is Batting Game Score between 0 and 2
Above average is Batting Game Score higher than 2
Below average is Batting Game Score less than 0

Players on the 40-man roster are in bold.  The ones without options are also underlined.  Left-handed pitchers are in italics.

Here is the Dashboard for the Twins' position players:


And for the Pitchers:


3/8/14

Speculation on the Twins' first Spring Training cuts and updated battle dashboards

Like most teams the Minnesota Twins will be announcing the first cuts of the major league Spring Training camp very soon.  Who will those players be?

One group of players who gets cut first are players on the 40-man roster who do not have much likelihood to make the team and were added on the roster for protection's sake.   I think that Logan Darnell, Max Kepler, Jorge Polanco and Kennys Vargas  will be the four casualties from this category.  I think that Trevor May is on the bubble and might be in the first cuts list as well, because he has been pitching primarily in relief (and not that great) and will need to be stretched as a starter and it might be good timing with the minor league games starting the coming Monday.  Edgar Ibarra, who has yet to play because of Hepatitis B, is another serious candidate to go to the minor league camp to recuperate.

I think that the Twins will want to have a longer look on Danny Santana, Kris Johnson (they are performing really well and with Pedro Florimon yet to play because of his apendectomy and the fifth starter job wide open, there might be real opportunities).   I also suspect that the Twins would want a longer look on Brooks Raley because he just has not been around much and they might need to make a decision on his 40-man roster spot.

There is not much pressure to cut non-roster invitees (because they do not have to be in the Major League DL, receive ML pay and have their clocks ticking, if there is an injury during camp,) but I suspect that some will be cut as well.   Sean Gilmartin would be a good candidate from this group because of the opportunity to get stretched in Minor League games.  Also with the reduction in pitchers, the Twins are likely to demote a catcher or two, because they do not need them, with Stuart Turner and Matt Koch being the most likely.  Even though Jason Kubel and Jason Bartlett are having a hard time hitting the ball, I suspect that the Twins will give them every opportunity to succeed in Spring Training.  This might not be the case for Chris Rahl who sees fellow non-roster outfielder invitees Jermaine Mitchell, Darin Mastroianni and Wilkin Ramirez performing better than him.

Here are the latest battle dashboards updated for today's game (and you can find all of the 2014 Spring Training dashboards here) :

A reminder of the scoring system:


For the pitchers, I quantify using  a measurement created by Bill James more than a decade ago called "Game Score".  It is calculated as follows:
You start with 50 points for each pitcher.
Add 1 point for each out.
Add 1 point for each strikeout.
Subtract 2 points for each hit.
Subtract 4 points for each earned run.
Subtract 2 points for each unearned run.
Subtract 1 point for each walk.
There is a point bonus for pitching more than 4 innings as well, adding 2 points for each IP after the 4th, but this is not too applicable here.

Game Scored of 49-51 are "average" (yellow),
everything higher than 51 "above average" (green),
and everything below 49 "below average" (red).

For position players, I devised a similar metric that goes like this:
Start with 0 points (unlike the pitching Game Score that starts with 50)
Add 1 point for each Run, RBI, 2B, SB, BB, and HBP recorded.
Add 2.5 for each hit, 3 for each 3B and 4 for each HR.
Subtract 1 for each CS and GIDP,
subtract 1 for each error,
for catchers add 1 for each CS
Subtract 0.2 for each SO and 0.5 for each AB.

Again, as in the Pitching Battle Dashboard, the Position Player Battle Dashboard is color-coded based on average, above average and below average performances, where:

Average is Batting Game Score between 0 and 2
Above average is Batting Game Score higher than 2
Below average is Batting Game Score less than 0

Players on the 40-man roster are in bold.  The ones without options are also underlined.  Lefty pitchers are in italics.

Here is the Dashboard for the Twins' position players:


And for the Twins' pitchers:


3/6/14

Diamond's Back Foot and Twins Spring Training Dashboards

The Twins lost to the Baltimore Orioles' travel squad yesterday in a pretty bad way (11-5.)  Here are the Spring Training Battle Dashboards updated after yesterday's game:

For position players:


For pitchers


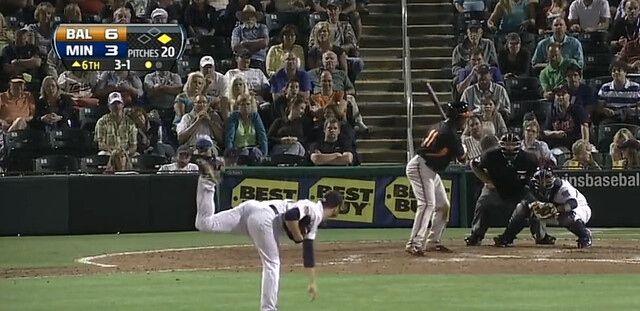
Scott Diamond's performance, even though collectively awful, and reflected by the lowest Game Score this season, it was a tale of two innings:  He pitched a really excellent fifth inning (which actually made me think that he might be a decent choice for the pen potentially, if he does not make the rotation,) and a really really poor sixth inning with balls going all over the place and a hard time throwing strikes. What was the difference? 

In the fifth inning he pitched fast and had a very fluid delivery.  One single fluid non-stop motion. In the sixth inning he was tentative and looked like he was thinking too much about what he was throwing and it was a lot like last season.  When Diamond does that, he tends to do this exaggerated pause at the end of his delivery and it is very noticeable with his back leg:  The foot hangs up in the air with the cleats facing upwards and his his body parallel to the ground, and he stays there immobile for a full second or two, as the pitch is traveling to the plate and he is watching it hit the glove (or the bat or the dirt) in this position.

Like this:


It might make a pretty interesting yoga posture, but not good baseball:  That pitch is almost in the glove, the delivery should have ended, both feet should be on the ground and he should be ready to field his position.  And all those things mentioned in the previous sentence were there for Diamond the previous (successful) inning.

I don't think that it is a cause and effect relationship (as if the exaggerated pausing and posturing would cause bad pitches) but a symptom of maybe forcing it up there or thinking too much or trying to be too perfect, instead of just pitching and letting go.  He did the same pausing at the end of his delivery all last season.

Just another thing to watch this Spring.


3/4/14

Twins 2014 Locks, Spring Training Battles and the first Battle Dashboards

As in the past few years I will use dashboards to keep track of the performance of the Twins' players during Spring Training in order to get a numerical and visual representation of who is doing what, of the players who are battling for a position on the 40-man roster.  With few games in and the first cuts coming early next week, it might be a good time for the first one of these.

To determine that, we need to figure out who are the "locks" to come up North with the Twins. 

As far as position players go, Joe Mauer, Brian Dozier, Trevor Plouffe, and Josh Willingham are locks for starting positions.  Kurt Suzuki is also a lock to make the 25-man roster, but not a lock to start, so he is included in the list.   A lot of people might think that Pedro Florimon might also be a lock, but I think that he has to work to make it up North. 

The major Spring Battles for position players are:  The starting and backup catcher jobs, the starting SS job, the starting DH job, two of the starting OFs, and bench positions. 

As far as the rotation goes, Ricky Nolasco, Phil Hughes and Mike Pelfrey are locks.  Kevin Correia might still be considered a lock by man, however he could potentially be beaten for the fourth spot in the rotation and get traded before Spring Training.  In addition, the fifth spot in the rotation is wide-open.

As far as the pen goes, the only locks I see are Glen Perkins, Jared Burton, Brian Duensing and Anthony Swarzak, again pending trades.  The starting pitcher combatants for the last rotation spot(s) could also gain positions in the pen.

From the list I excluded players like Kennys Vargas, Byron Buxton, Max Kepler et al who will not make the Twins out of Spring Training.

A reminder of the scoring system:

For the pitchers, I quantify using  a measurement created by Bill James more than a decade ago called "Game Score".  It is calculated as follows:
You start with 50 points for each pitcher.
Add 1 point for each out.
Add 1 point for each strikeout.
Subtract 2 points for each hit.
Subtract 4 points for each earned run.
Subtract 2 points for each unearned run.
Subtract 1 point for each walk.
There is a point bonus for pitching more than 4 innings as well, adding 2 points for each IP after the 4th, but this is not too applicable here.

Game Scored of 49-51 are "average" (yellow),
everything higher than 51 "above average" (green),
and everything below 49 "below average" (red).

For position players, I devised a similar metric that goes like this:
Start with 0 points (unlike the pitching Game Score that starts with 50)
Add 1 point for each Run, RBI, 2B, SB, BB, and HBP recorded.
Add 2.5 for each hit, 3 for each 3B and 4 for each HR.
Subtract 1 for each CS and GIDP,
subtract 1 for each error,
for catchers add 1 for each CS
Subtract 0.2 for each SO and 0.5 for each AB.

Again, as in the Pitching Battle Dashboard, the Position Player Battle Dashboard is color-coded based on average, above average and below average performances, where:

Average is Batting Game Score between 0 and 2
Above average is Batting Game Score higher than 2
Below average is Batting Game Score less than 0

Players on the 40-man roster are in bold.  The ones without options are also underlined.  Lefty pitchers are in italics.

Here is the Dashboard for the Twins' position players:


And here for the Pitchers: