Showing posts with label pitching. Show all posts

12/24/13

By the numbers: a body count of the Twins' pitching depth for 2014 and myth busting

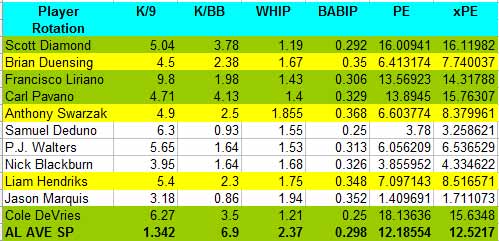
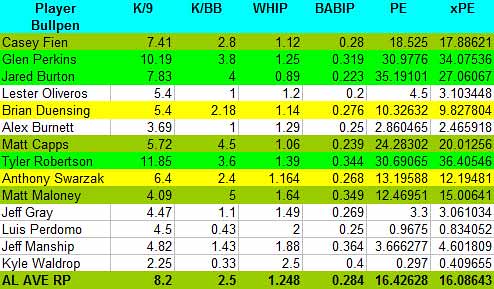
The major priority of the Minnesota Twins' General Manager, Terry Ryan, has been to re-build a rotation that has been at the bottom of the major leagues in pretty much every statistical category in 2014.   There is a general agreement that the rotation was pretty much "a mess" in 2013 and needed fixing.  There is also the general impression that the Twins' pen was one of the strengths of the team and it is better left alone.   However, this impression is false because in 2013 the Twins' pen ranked:

17th out of 30 MLB teams as far as ERA goes
17th out of 30 MLB teams as far as FIP goes
17th out of 30 MLB teams as far as SIERA goes
8th out of 30 MLB teams as far as WHIP goes
19th out of 30 MLB teams as far as K% goes

In other words, the Twins' pen, which compared to the Twins' rotation seemed great, when compared to the rest of the major league pens is proven to be average at best. 

Busted myth number one:  The Twins' pen was not great in 2013 and, while it might have been a bright point in 2013 compared to the rest of the team, it does not cut the mustard compared to the rest of league.

There is a lot of room for improvement and I suspect that Terry Ryan will address before Spring Training, since that will go a long way for the Twins to be competitive in 2014.

After the recent additions of new and returning starting pitchers there have been arguments that the Twins have too many starting pitchers and there is a logjam or pitchers on the Twins' roster.

I  thought that it might be a good time to take a breath and look at what the Twins have on their 40-man roster as far as pitching goes, and see whether this argument is true or not.

Here is the Twins' 40 man roster (alphabetically) broken down in groups (players in bold are out of options):

Group A: Starting pitchers with no options signed to sizeable contracts the last 2 seasons.

Kevin Correia (RHSP)
Phil Hughes (RHSP)
Rick Nolasco (RHSP)
Mike Pelfrey (RHSP)


Group B: Relief pitchers with no options signed to sizeable contracts the last 2 seasons or offered arbitration.

Jared Burton (RHRP)
Brian Duensing (LHSP/RP)
Glen Perkins (LHRP)
Anthony Swarzak (RHSP/RP)


 Group C: Starting pitchers with no options with small contacts who played in the majors for more than 3 seasons.

Sam Deduno (RHSP)
Scott Diamond (LHSP)
Vance Worley (RHSP)


Group D: Starting and relief pitchers with options with small contacts who played in the majors for at least one season.

Andrew Albers (LHSP)
Casey Fien (RHRP)
Kyle Gibson (RHSP)
Kris Johnson (LHSP)
Ryan Pressly (RHRP)
Caleb Thielbar (LHRP)
Michael Tonkin (RHRP)


Group E: Starting and relief pitchers with options with small contacts who never  played in the majors.

Logan Darnell (LHSP)
Edgar Ibarra (LHRP)
Trevor May (RHSP)


Broken down this way, the perceived logjam of Twins' staring pitchers becomes pretty clear:

The Twins usually have a 12 man pitching staff.  They currently have 4 starters and 4 relievers (groups A and B) who are pretty much guaranteed a job.  This opens 4 more positions, one in the rotation and 3 in the pen.  If you assume that the Twins value all pitchers in Group C who are out of options, they have the space to find them all a major league job, as well as allow another pitcher, likely from Group D or potentially outside the organization, to gain a rotation or bullpen position.  The rest of the players will provide depth in AAA and be there in case of emergency or potentially be offered in trades to fill additional needs, like position players.

Busted myth number two:  There is no pitching logjam on the Twins' roster.

In other words, the Twins do have a lot of pitching depth in their 40-man roster, but they are not in a logjam situation where they cannot accommodate all their pitchers without options on their 25-man roster.  And this assumes that Samuel Deduno who is recuperating from double (labrum and rotation cuff) shoulder surgery is available to start the season, which is an extremely optimistic approach right now.

While it is too early to name names to complete the rotation and the pen, because changes will likely happen before spring training,  this early clearly the Twins are not in any sort of a pitching logjam and also have plenty of options.


12/7/13

Crystal Ball: Predicting free agent starting pitcher performance for 2014.

A crystal ball is for baseball front offices what the philosophers' stone was for medieval alchemists: probably the single most desirable tool out there.   And there have been a lot of predictive tools, including tools that can spit out a whole slash line of MLB future for a 19 year old prospect in high A.   I think that some of them, at least at that level, are borderline silly. 

I took a look at potentially creating at a tool that was a bit more complicated that ERA/FIP or xFIP differential that can tell a couple of things at the same time:  a. how good has someone been and b. how good is someone going to be in the near future.   I did not want to predict W-L, ERA, IP and such.  That is silly in my book.   So I run the thing through 2009 to 2010, 2010 to 2011, 2011 to 2012 season differentials of individual pitchers to look for accuracy as far as improvement and decline went, and I got about 80% accuracy for pitchers who started a baseline of 100 innings the previous season. 

Not that bad, but the algorithm still needs refinement for the lower inning pitchers; ideally I would like it to work at 50, so one could be able to potentially extrapolate September call up performances for the next season.    Also, there is one thing that math cannot do, and that is take into account whether a young pitcher improves a particular pitch or learns another before the next season.  At this point, I would say that it is not really great to predict young pitchers' performance.   So it is not ready for release.   One thing that I feel pretty confident about is that it is pretty good to predict mid-late career pitchers' performance.  Free agents do fall into this category, so with the winter meetings coming up, I felt that I could present the predictions about starting pitcher performance in 2014.  This includes Ricky Nolasco and Phil Hughes, the two Twins' free agent signees.  

Mainly a bookmark, so I can check again after the season to see how it did vs. actual performance, but I thought that it might be fun to share.  

Here is the list (with a lot of incompletes, as I indicated)

I am indicating the Twins' signees in bold and potentially good targets yet unsigned in italics and underlined. According this crystal ball the Twins did pretty well...

Alfredo Aceves (31) - not enough in 2013
Bronson Arroyo (37)  - mid rotation - Consistent Decline
Scott Baker (32) - not enough in 2013
Erik Bedard (35) - end of rotation - Consistent Improvement
Travis Blackley (31) - not enough in 2013
A.J. Burnett (37) - top rotation - Consistent Improvement
Chris Capuano (35) - mid rotation - Consistent Improvement

Chris Carpenter (39)  - not enough in 2013
Bruce Chen (37) - end of rotation - Consistent Decline
Bartolo Colon (41) - mid rotation - Consistent Decline
Scott Feldman (30) - end of rotation - Consistent Decline
Gavin Floyd (31)   - not enough in 2013
Jeff Francis (33) - not enough in 2013
Freddy Garcia (37) - not enough in 2013
Jon Garland (34) - not enough in 2013
Matt Garza (30) - mid rotation - Consistent stay the same
Chad Gaudin (31) - not enough in 2013
Roy Halladay (37) - not enough in 2013
Jason Hammel (31) - end of rotation - conflict: same or improvement
Aaron Harang (36) - mid rotation - conflict: decline or improvement
Dan Haren (33) - top rotation - Consistent Improvement
Roberto Hernandez (33) - mid rotation - Consistent Improvement
Phil Hughes (28)  - mid rotation - Consistent Improvement
Ubaldo Jimenez (30) - mid rotation - conflict: decline or improvement
Josh Johnson (30)  - not enough in 2013
Jair Jurrjens (28)  - not enough in 2013
Jeff Karstens (31)  - not enough in 2013
Scott Kazmir (30) - top rotation - Consistent Improvement
Hiroki Kuroda (39) - mid rotation - Consistent Decline
John Lannan (29) - not enough in 2013
Colby Lewis (34)  - not enough in 2013
Ted Lilly (38) - not enough in 2013
Paul Maholm (32) - end of rotation - Consistent Improvement
Shaun Marcum (32)- not enough in 2013
Jason Marquis (35) - replacement level - Consistent Decline
Daisuke Matsuzaka (33) - not enough in 2013
James McDonald (29) - not enough in 2013
Jeff Niemann (31) - not enough in 2013
Ricky Nolasco (31)  - mid rotation - Consistent Improvement
Sean O'Sullivan (26)- not enough in 2013
Roy Oswalt (35)- not enough in 2013
Mike Pelfrey (30)  - end of rotation - Consistent Improvement
Greg Reynolds (28) - not enough in 2013
Clayton Richard (30) - not enough in 2013
Ervin Santana (31)  - mid rotation - Consistent Decline
Johan Santana (34) - not enough in 2013
Joe Saunders (33)  - replacement level - Consistent Improvement
Kevin Slowey (30)- not enough in 2013
Masahiro Tanaka (25) - not enough in 2013
Jason Vargas (31)  - mid rotation - Consistent Improvement
Ryan Vogelsong (36)  - not enough in 2013
Edinson Volquez (30) - mid rotation - Consistent Improvement
Tsuyoshi Wada (33)  - not enough in 2013
P.J. Walters (29)  - not enough in 2013
Jake Westbrook (36)  - not enough in 2013
Chien-Ming Wang (34) - not enough in 2013
Suk-Min Yoon (27) - not enough in 2013
Barry Zito (36)   - replacement level - Consistent Improvement


11/27/13

Wednesday Graphic in Technicolor: The Twins pitchers transformed into human rain delays in 2013

For most of the fans who watched the Minnesota Twins play in 2013, one thing was fairly obvious:  the pitchers were taking their sweet time on the mound between pitches.   I suspect that the collective gut feeling of the Twins' Territory is that it was bad, but how bad exactly was is?  

Mike Hargrove in his playing days was nicknamed the human rain delay because of his elaborate routine at the batter's box between pitches.   He was the original, but shares the nickname with a pitcher, Steve Trachsel who took his sweet time on the mound between pitches.   Because of PitchF/X and because Trachsel pitched his last couple seasons when the technology was there, we now can quantify the average time between pitches for the human rain delay:  It is 23.6 seconds

How bad were the Twins?  

Here is a graph indicating the seconds between pitches of all the Twins' pitchers who pitched more than 3 innings in 2013 (Sorry Tyler Robertson and Jamey Carroll), along with their individual numbers the previous 3 seasons (2010-2012).  At the end there is an average of the previous 3 seasons and the difference of 2013 from that average:


Five Twins pitchers, Brian Duensing, Mike Pelfrey, Jared Burton, Casey Fien and Kevin Correia were worse than the human rain delay.   And a sixth, Liam Hendriks, was at the ballpark.   The MLB average time between pitches is 20.8 seconds, the Twins took a total of 2 more seconds than that in average.   Only two players, Shairon Martis and PJ Walters pitched faster than the MLB average.

Also, of interest is that other than 3 players (Walters, Cole DeVries and Josh Roenicke; all former Twins now) who decreased their time between pitches in 2013 compared to their 3 previous season average and 2 players (Samuel Deduno and Pedron Hernandez, another former Twin) who remained constant, the rest increased their time between pitches this season.  Brian Duensing, Mike Pelfrey, Kevin Correia, Liam Hendriks, Glen Perkins and Vance Worley were the biggest culprits, with Dunsing's and Pelfrey's differentials at an astonishing 3-4 second rate.

Working fast and keeping your defense on their toes, has been an axiom as far as successful pitching goes.  Is this part of the Twins' woes in 2013?  Was the fact that Vance Worley took 2 more seconds between pitches this season and indicator of problems on the mount, which translated to below expectations?  The cause and effect are not certain here, but this is something that the Twins might want to address during the 2014 Spring Training.

11/18/13

Monday Graphic in Technicolor: 135 MLB starting pitchers classified based on 2013 performance, including the MNTwins targets.

Not many words because this picture (which you might have to wait until it loads) is worth and has more than 1000.  Here are the names and 2013 numbers of all 135 MLB starting pitchers who pitched more than 100 innings.  I thought that it would be a good reference as transaction will be taking place this off-season.  The measurements included are: K/9, K/BB, K%, WHIP, BABIP, ERA, FIP, E-F (ERA-FIP),  xFIP,  tERA, SIERA, PE, xPE.   If you are not familiar with PE and xPE, more on those here.    The pitchers are color coded based on the PE/xPE standards listed here with the key being:


Where "REPL" is replacement level.   Interesting to see that there are only nice pitchers with Ace performance (PE) or potential (xPE) based on the 2013 numbers and only fifteen number 1/2 starters (including a couple of free agents) based on the same criteria.  From the 3 Twins' starters that pitched more than 110 innings, two were in the 4 to 5 starter range (Pelfrey, Correia) and one (Diamond) in the Replacement range.  The list is shorted by increasing FIP.

Without further ado:


11/6/13

Naming names: The three starting pitchers the Minnesota Twins should sign in free agency

It is not a secret, that the biggest problem the Minnesota Twins had in the past few woeful season, as far as players are concerned, is the lack of a reliable rotation.   While a lot of fans are looking at 2015 or 2016 as the potential contenting point for the Twins, when Miguel Sano and Byron Buxton "come to age", the dirty secret is that there are not (other than Alex Meyer and potentially Kyle Gibson above A level) any sure bets for top of the rotation pitchers in the system, which, almost certainly would guarantee mediocrity at best for the middle of this decade.

This off-season the Twins have an opportunity to remediate this via free agency and, in addition to 2015 and beyond, be competitive in 2014.  In order to do so, the Twins would need to sign at least 3 pitchers better than Kevin Correia who can be a place holder for Alex Meyer, in his last contract year and with Kyle Gibson would be the 2 remaining parts of the Twins' rotation in 2014.   Who should those three new pitchers be?   What would it take to sign them?    Remember, we are not looking only for 2014, but we are looking beyond.  And we are looking for numbers one, two and three in the Twins' rotation, allowing Gibson to be number four and Correia number five, which would result in a competitive rotation.   Potentially one of these positions could come internally:  Alex Meyer might be one out of Spring Training;  I have not given up on Vance Worley because of an awful injury, out-of-shapeness and bad luck (BABIP) induced, age 25 season;  and nobody knows whether Samuel Deduno might take the next step.

What characteristics those free agents should have?

If you look at the measurable characteristics the top pitchers have, two jump out right away, and these 2 happen to be the exact ones the Twins' rotation has been lacking:

a. Hard throwing.   Average Fastball velocity in MLB is 92 mph, including relievers
b. Missing bats.   Average K/9 is around 7 in the majors, so we are looking for top of the rotation players with K/9 above 8.

Only 3 Minnesota Twins starting pitchers, both left-handed, since PitchF/X was introduced allowing the measurement of pitch velocities, satisfied that criteria:  Johan Santana (2004, 2005, 2006) and  Fransisco Liriano (2005, 2006, 2010).


And because of the long-term vision (we are looking for players who can get 3+1 or 4+1 contacts and would be with the team for the biggest part of the decade when Sano and Buxton come to age) the Twins need to look at pitchers who would at mostly be 31 years old in 2014, so they do not pay for a pitcher's declining seasons.   One can argue that an older pitcher can be signed in an one or two year contract as a place holder for someone like Kohl Steward, which is a valid argument, but at this point it does not guarantee competitiveness, since Kohl Steward is not a sure bet now.

Here are the 3 criteria (all measurable) the Twins should look for in a free agent:

a. Average FB velocity >= 92 mph
b. K/9 >= 8
c. Age in 2014 season =< 31

Here is a list of all 2014 free agent starting pitchers, from MLB trade rumors, alphabetically and with 2014 season ages in parenthesis:

Alfredo Aceves (31)
Bronson Arroyo (37)
Scott Baker (32)
Erik Bedard (35)
Travis Blackley (31)
A.J. Burnett (37)
Chris Capuano (35)
Chris Carpenter (39)
Bruce Chen (37)
Bartolo Colon (41)
Scott Feldman (30)
Gavin Floyd (31)
Jeff Francis (33)
Freddy Garcia (37)
Jon Garland (34)
Matt Garza (30)
Chad Gaudin (31)
Roy Halladay (37)
Jason Hammel (31)
Aaron Harang (36)
Dan Haren (33)
Roberto Hernandez (33)
Tim Hudson (38)
Phil Hughes (28)
Ubaldo Jimenez (30)
Josh Johnson (30)
Jair Jurrjens (28)
Jeff Karstens (31)
Scott Kazmir (30)
Hiroki Kuroda (39)
John Lannan (29)
Wade LeBlanc (29)
Jon Lester (30)
Colby Lewis (34)
Ted Lilly (38)
Paul Maholm (32)
Shaun Marcum (32)
Jason Marquis (35)
Daisuke Matsuzaka (33)
James McDonald (29)
Randy Messenger (32)
Ricky Nolasco (31)
Sean O'Sullivan (26)
Roy Oswalt (35)
Mike Pelfrey (30)
Greg Reynolds (28)
Clayton Richard (30)
Ervin Santana (31)
Johan Santana (34)
Joe Saunders (33)
Kevin Slowey (30)
Masahiro Tanaka (25)
Jason Vargas (31)
Ryan Vogelsong (36)

Trimming the list by age, and listing K/9 and average FB velocity for both 2012 and 2013, disqualifying pitchers who (because we are looking mostly for "sure bets".  Reclamation projects and bargains could fit for one of these positions, but are out of scope for this exercise.)  :

a. pitched less than 50 innings due to injury in 2013
b. pitched mostly in the pen in 2013
c. pitched mostly in minor or foreign leagues in 2013 

we have this list (with K/9 and FB velocity fitting the criteria indicated in green, if fit complete or in yellow if fit when rounded up to no decimals) :


The "A" list (at least two pitchers should be from this list) :

Matt Garza, RHP, 30.  Difficult to see a Garza reunion with Ron Gardenhire and Rick Anderson still on the Twins' staff.  Documented personality conflicts when with the Twins

Ubaldo Jimenez, RHP, 30. Received a qualifying offer, which means the Twins will have to surrender their second round pick to sign him.  Price will be high because of monster second half.

Josh Johnson, RHP, 30.  No qualifying offers.  Health and performance consideration (if one looks at W-L and ERA; but solid xFIP and peripherals) will drop the price

Scott Kazmir, LHP, 30.  The only lefty in the list.  No qualifying offer.  Great year suggests that recovered from injury nicely

Edinson Volquez, RHP, 30 .  No qualifying offer.  Very quietly made it to the list.  A sleeper, potentially low cost signing


The "B" list (potentially one pitcher should be from this list, but there are questions) :

Phil Hughes (28)  He is intriguing; close with the K/9.  Still in early prime.  Can be the one from this group to target

Jon Lester (30) Will likely stay with the Red Sox.  Expensive.  Lots of people think of him as an "A list" pitcher but is not.

Mike Pelfrey (30)  Interesting to see him in the list, but his K/9 is not in the ball park.  Can he get his K/9 up?  Great fit in the Twins' club house.  Should the Twins take another flier with Pelfrey another year away from TJ surgery?

 Ervin Santana (31) Expensive.  Lots of people think of him as an "A list" pitcher but is not.   Received a qualifying offer. Stay away for the money.  More expensive that all the pitchers in the A list, other than Jimenez.


The rest:

Gaudin was a reliever in 2012 when he met the criteria.  Nolasco and Vargas are thought to belong in the "A list" potentially.  They do not.

Who are the three starting pitchers the Minnesota Twins should sign in 2013, in order to be competitive in 2014 and beyond?  They are:

Josh Johnson
Scott Kazmir
Edinson Volquez

Can they sign all three?  The short answer is "yes", but I will examine the Twins' budget in another post...


8/27/13

I can't drive 55: The Twins' fireballers

One of the eyeballing observations of the 2012 2013 Minnesota Twins, is that, well, their pitchers do not throw that hard, compared to the other teams.  Putting this theory to test, here are the average fastball velocities of the Twins' pitchers this season (data from fangraphs):

Relievers:

Glen Perkins  94.8                   
Michael Tonkin 94.5    
Ryan Pressly  93.2
Brian Duensing  92.2
Jared Burton  92.0
Anthony Swarzak 91.9
Josh Roenicke  91.4   
Casey Fien  90.6
Caleb Thielbar 89.5

Starters:

Mike Pelfrey 92.2
Kyle Gibson 92.1       
Kevin Correia 90.4   
Samuel Deduno 90.3  
Liam Hendriks 90.0       
Vance Worley 89.5    
P.J. Walters 89.4  
Scott Diamond 88.4    
Pedro Hernandez 88.4          
Andrew Albers 85.

How do those compare with the rest of the pitchers in the majors?

Here are some rankings:

Glen Perkins: 64th
Michael Tonkin: 84th
Ryan Pressly: 166th
Brian Duensing: 256th
Mike Pelfrey: 257th
Kyle Gibson: 265th

And these are the guys above the MLB mean

So we have: 

- A "proven closer"
- A rookie reliever who has appeared in a couple of games (or three)
- Another rookie reliever who has appeared sparingly because he is a rule 5 guy, thus "not proven"
- A lefty set up guy who is so underrated and unappreciated that the Twins'  manager and pitching coached practically replace him with the softest tossing reliever in the team
- Two starters both of whom had Tommy John surgery, one of whom is a free agent and has made the fastest TJ recovery on the record, and the other one just had a cup of coffee in the major league club this season.

Any questions about why the Twins' pitching is a mess?


1/26/13

Assessing the Starting Pitching in the Twins' Organization

For a baseball team to content, one of three things need to happen:
  1. An organization has to develop impact starting pitchers.
  2. An organization has to trade for impact starting pitcher.
  3. An organizations has to sign impact starting pitcher free agents.
I demonstrated earlier this month that the Twins' last two year abysmal record could have been predicted as earlier as 2008, based on the state of their starting pitching prospects.  Only 11 pitchers who have been in the Twins' minors in 2008 are still in the organization and none has been an impact starter.  The Twins have been adverse in doing numbers 2 and 3 above, so in order to compete, they have to develop starting pitching talent.

The Denard Span and Ben Revere trades infused the Twins with 3 young starting pitchers: Vince Worley, 24, and Trevor May and Alex Meyer, both 22, which makes the future a bit more hopeful.  How hopeful?  I will try to quantify, so the rest of the discussion here will be metrics and numbers based.  This will actually be somewhat of a logical continuation of this analysis, where in August last year, I tried to look positively into the 2012 Minnesota Twins pitching and draw conclusions based on potential.  What I am doing here is looking at the whole organization Starting Pitching, under very similar metrics and see what the future might look like.  This will include potential rankings of Twins' starters, but it is not a prospect list.  They are based on their 2012 performance (and adjusted for age and playing level) and not their potential.  Injured players, such as Wimmers and Salcedo will be higher on prospect lists that ranked here, because their numbers were awful.

The metrics I like to use to do this have been some simple things of my own device: Pitching Effectiveness or PE and Expected Pitching Effectiveness or xPE.  I fiddled around with PE in 2008 and with xPE in 2009.  Here is the reason I devised PE and here is the reason I optimized it to xPE.  My main arguments were a. I felt like xFIP and FIP and DICE weigh too much things like home runs (which anyone who watched the home runs by Miquel Cabrera and Delmon Young against the Twins yesterday cannot deny that they are a matter of inches and ballpark and luck and fielding performance from being a long fly ball).  Also these formulae are hard to memorize and I wanted something simple I can calculate looking at a stat sheet and also something that you can calculate using splits (e.g. how has Brian Duensing or Glen Perkins been as a starter vs as a reliever); you can find xFIP around, but not in a spit form.  So in 2008 I devised PE, which simple takes account three things:  Strikeouts, walks and hits.  So a pitcher who strikes out more people, walks fewer and gives lesser hits is more likely to succeed than someone who doesn't.  And all hits are counted equal because the difference between a single and a triple might be the difference of having Delmon Young or Ben Revere play Left Field or the difference between a fly ball out and a home run might be the difference of having Torii Hunter or Rich Becker playing Center Field.  And I use WHIP, K/9 and K/BB to calculate PE (a simple PE= (K/9*K/BB)/WHIP).  xPE further normalizes for BABIP (to league average .290) to account for "luck" with hits.  And unlike FIP and ERA, these two measures go the opposite directions (higher is better) and have a large variation (0.x to 100+) to allow for granularity in comparisons vs. compressing performance from 0 to 10 or so.  Over here, I show that xFIP and FIP correlate pretty well to the much more complex SIERA, which is way too complex to be able to calculate just with a cell phone calculate (which is my goal as far as metrics go.)

PE and xPE have been fine to show performance and expected performance.  How about potential?  This is the many million dollar question, because if someone is able to guess estimate future potential of a player in single A, he/she will be having a great advantage in identifying cheap, future impact players, in a more objective way than scouting reports.  So yet a new measure in the PE family has been devised:  the adjusted expected pitching effectiveness or axPE.  I tried something similar the off-season after the 2008 season, but the resulting formula was too complicated (cannot fit on a T-shirt or be calculated using a cell phone calculator), so needed to be refined.  I hope I am close to this, since axPE is simpler.  It takes into consideration level of play.  Each level of play gets a number.  Here are these numbers:

All Rookie Leagues: 1
A: 2
A+: 3
AA: 4
AAA: 5
MLB: 6

the average of the levels a player participated is taken into consideration for axPE.  For example if a pitcher spent part of the season in high A and then moved to AA, the average level grade is 3.5.

The other adjustment involves someone's age.  Younger players in higher levels have higher potential; this is the premise here. axPE is defined as xPE* (level/age) *7 .  The 7 is a coefficient that makes it a number  in the neighborhood of PE and xPE.

A note of importance:  agPE is biased towards better performance in higher levels; this is by design, since there have been pitchers who blew away rookie leagues and then bottomed out when they went to AA.

The PE family metrics translators for starters (and relievers, for the sake of completeness, but RP are out of score here) are roughly translated to:

Rotation:
xPE/axPE
35+ Ace
25-35 #1- #2 Starter
15-25 #2- #3 Starter
10-15 #3 - #4 Starter
7.5-10 #5 Starter

Bullpen:
xPE/axPE
35+ Closer
25-35 Closer-Setup
15-25 Setup- Long Relief
8-15 Long Relief-Mopup

where axPE denotes intermediate/long term potential.

So, do the Twins have any potentially impact starters in their organization, based on their 2012 performance?

Without further ado, here are the numbers, that include pretty much every pitcher in the Twins organization, including the new ones, and those who pitched only in the major league level in 2012, under 30 years old.  The age indicated is their age in 2012.  I am including Nick Blackburn, for comparison's sake.  Raw data is taken from B-R and an (*) denotes LHP:


Thus,  it looks like the Twins have 3 potential impact starters in their organization; Kyle Gibson and Alex Meyer are not a surprise.  Cole DeVries is.  Cole DeVries' axPE is higher than his xPE level (which turns out to suggest a middle of the rotation starter), because he performed at the MLB level.  Whether or not potential is applicable to a 28 year old who has reached the majors, is a good discussion.   On the other extreme, some of the K/9 leaders in the organization, Josue Montanez, Taylor Rogers, Felix Jorge, Tyler Jones have repressed axPE, because they are still at the lower levels of the organization.  I think that they need to prove themselves at higher level.

Based on this, and if you cut the list at 25 years old or younger, the Twins have at least couple of pitchers who have impact starter (i.e. top of the rotation/ace) potential and several who have mid-rotation potential. 

A huge qualifier:  This list is of pitchers who were used mostly as starters (i.e. made more starts than relief appearances in 2012.)  This leaves at least one particular pitcher out who should be included, but he made 4 starts and 7 relief appearances:  Jose Berrios.  His numbers (albeit in 11 games and 30 some innings) are out of this world: 284.12 PE, 236.11 xPE, and 91.82 axPE.  He should be part of the discussion and definitely has top of the rotation potential, but there is an asterisk for the reasons mentioned.

Others who made few starts but mostly used in a relief role but definitely should be part of the equation are (in no order) : Matt Houser, Miguel Munoz, AJ Achter, Cole Johnson, Argentis Silva (the 16 year old high bonus singing) Elias Villasarra, Fernando Romero, Luke Bard, Jose Jimenez, Corey Kimes, Brett Lee and Mason Melotakis.

Again, this is an intermediate term discussion and does not really involve recent Twins veteran acquisitions Rich Harden, Mike Pelfrey and Kevin Correia.


1/19/13

An illustration of what is in the heart of the Twins pitching problems

With Catchers and Pitchers reporting in less that one month for Spring Training 2013, I decided to get ready for my Spring Training Coverage (teaser: expect 3 new guides this month) so I was looking at the past coverage here.  I stumbled upon this little piece from the end of the 2009 Spring Training.  It looks really innocent.  After all it is a list of all 97 pitchers in the Twins' minors in 2008 from DSL to AAA, who were still with the organization in 2009 along with the 2009 MiLB FAs and where they would potentially end up in 2008.

Fairly innocent.

Until you fast forward to 2013, where you see that only 11 of those 97 players are still in the Twins' organization in any level and nobody made any impact in the Twins' rotation.  The best players in the list were swingmen and bullpen arms.  Here is the list of the 11 who are still with the Twins (the original list of 97 is here ):

Alex Burnett
Cole Devries
Brian Duensing 
Deolis Guerra
B.J. Hermsen
Bruce Pugh
Tyler Robertson
Adrian Salcedo
Anthony Slama 
Tom Stuifbergen
Anthony Swarzak

So if your minor league system does not feed the major league team with impact starters for 4 years and you do not sign impact starters via free agency or acquire them via trades, how do you expect to compete?

The writing for the mess that was 2011 and 2012 was on the wall for the Twins in 2009.  They either just could not see it (by believing that their prospects were better than what they were) or they ignore it.  Either way, it is equally bad.
'

8/16/12

xPE, xFIP, SIERA, the 2012 Twins pitching and other stories

For a while I wanted to take a bit of a formalized look at the Twins' pitching this season to see what we have learned and see what would make sense for the team to do in the future.  Also, it has been a while since I took a formalized look at Twins pitching, so it was about time.

The metrics I like to use to do this have been some simple things of my own device: Pitching Effectiveness or PE and Expected Pitching Effectiveness or xPE.  I fiddled around with PE in 2008 and with xPE in 2009.  Here is the reason I devised PE and here is the reason I optimized it to xPE.  My main arguments were a. I felt like xFIP and FIP and DICE weigh too much things like home runs (which anyone who watched the home runs by Miquel Cabrera and Delmon Young against the Twins yesterday cannot deny that they are a matter of inches and ballpark and luck and fielding performance from being a long fly ball).  Also these formulae are hard to memorize and I wanted something simple I can calculate looking at a stat sheet and also something that you can calculate using splits (e.g. how has Brian Duensing or Glen Perkins been as a starter vs as a reliever); you can find xFIP around, but not in a spit form.  So in 2008 I devised PE, which simple takes account three things:  Strikeouts, walks and hits.  So a pitcher who strikes out more people, walks fewer and gives lesser hits is more likely to succeed than someone who doesn't.  And all hits are counted equal because the difference between a single and a triple might be the difference of having Delmon Young or Ben Revere play Left Field or the difference between a fly ball out and a home run might be the difference of having Torii Hunter or Rich Becker playing Center Field.  And I use WHIP, K/9 and K/BB to calculate PE (a simple PE= (K/9*K/BB)/WHIP).  xPE further normalizes for BABIP (to league average .290) to account for "luck" with hits.  And unlike FIP and ERA, these two measures go the opposite directions (higher is better) and have a large variation (0.x to 100+) to allow for granularity in comparisons vs. compressing performance from 0 to 10 or so.

Fast-forward to 2010: Matt Swartz and Eric Seidman in a series of 4 articles at Baseball Prospectus (part 1, part 2, part 3 and part 4) introduced the metric of Skill-Interactive Earned Run Average or SIERA.  Automatically, I realized that these guys had something (because a lot of their argument of creating this measure were similar to my objections with FIP and xFIP) and the more and more I dug, the more and more I like it.  It basically looks at individual ways of pitching skills like inducing ground balls vs fly balls, striking out people, not walking people etc. Which is great. I think that is has become my favorite ERA-like measure (it too is on a ERA scale and lower is better) to look, but it is also a pain to derive (one needs Excel, on the other hand it is available in places like Fangraphs), but good luck try to figure splits like ground balls allowed as a starter vs as a reliever...  The formula for posterity's sake is:  SIERA = 6.145 – 16.986*(SO/PA) + 11.434*(BB/PA) – 1.858*((GB-FB-PU)/PA) + 7.653*((SO/PA)^2) +/– 6.664*(((GB-FB-PU)/PA)^2) + 10.130*(SO/PA)*((GB-FB-PU)/PA) – 5.195*(BB/PA)*((GB-FB-PU)/PA)

So, if it does not fit on a T-shirt (and it doesn't), I still need a quick way of looking at things.  In the following table I took aggregate (i.e. Duensing's numbers are both for starting and relieving) Twins pitching numbers from 2012 from Fangraphs, including ERA, FIP, xFIP, SIERA and tRA (another measure I am not going to get into right now), calculated PE and xPE and looked at how all correlate with SIERA, xFIP and ERA:


As I mentioned PE and xPE go on a different direction (bigger number is better) than the others (ERA, FIP, xFIP, tRA and SIERA) so -1 is the best possible correlation factor for those (that would be a perfect match)

Happy to say that xPE, xFIP and SIERA correlate really nicely with themselves than with FIP and tRA and they all do not correlate with ERA, which is a good thing.  Actually, I can get more into the nitty gritty dirt and say that xPE seems to correlate better with SIERRA in good to average performances and less in the bad performances, but still a .89 vs .91 correlation factor difference with this sample size is not significant.
(one of these off-seasons I promise I will play with bigger data samples, but I am keeping this about the Twins and their 2012 pitching....)

So how about them Twins?

I am looking at splits, so I am using xPE.  And I am looking at starters vs. relievers vs. the league averages trying to compare the Twins rotation and pen to those and see if I can make any sense doing this.  When I started this 3 and 4 years ago, PE and xPE average for AL starters was around 10 and for AL relievers around 11.5.   And here are some ranges and classifications

Rotation:
xPE
35+ Ace
25-35 #1- #2 Starter
15-25 #2- #3 Starter
10-15 #3 - #4 Starter
7.5-10 #5 Starter


Bullpen:

xPE
35+ Closer
25-35 Closer-Setup
15-25 Setup- Long Relief
8-15 Long Relief-Mopup


The dual classifications indicate positions in Championship-caliber teams vs average teams.  So in other words, in a championship team you better have 3 start pitchers with xPE above 15 and 2 with and xPE above 25 and a forth with xPE above 10.


Here is the data for the Twins rotation and pen (and for pitchers like Swarzak and Duensing I used their individual splits in each to calculate respective xPEs).  Huge surprise (should not be huge but...) :  By looking at the AL Averages, either pitching has improved, especially in the pen (where average xPE is 16; vs 12.5 in the rotation) or hitters do not hit the ball as well.  A 2.5 point jump in averages for starters and 5 point jump for relievers is huge.  And that would be an interesting thing to look during the off-season and might actually make me to adjust the classifications above upwards a bit.


Here are the numbers for the Twins rotation:


and here for the bullpen:


So as far as the rotation goes:

  • The Twins have had 4 number 3 type starters (and not all the time - a lot of Diamond's and De Vries' starts were given to Marquis, Walters and Blackburn) Pavano has been injured and Liriano has ranged from a number one to below replacement.
  • Going forwards the Twins can build on the fact that they have a couple of pitchers who can be number 3 starters in a good team (Diamond and De Vries) and someone who can be a number 5 starter (Hendriks) and seek a couple #1 and #2 starters to make a competitive rotation.
  • Brian Duensing and Anthony Swarzak are better in the pen
  • Something needs to be done with Nick Blackburn

As far as the pen goes:

  • The Twins have a core of 3 very good relievers (Robertson, Perkins, Burton)
  • Casey Fien has been a pleasant surprise
  • Adding Duensing and Swarzak completes a nice pen that would need an additional arm (could be a free agent or some September call up to step up)  It could be Capps, but his performance is not proportional to the $6.5 million option
  • Alex Burnett, Jeff Gray, Jeff Manship, have not been effective (the jury is still out on Perdomo, Oliveros, Maloney and Waldrop because of the small sample )


6/7/12

Myth Busting: The Rich Anderson Legacy or the Twins' pitching in the 00s

I think that a lot of the Minnesota Twins' fans have been frustrated with the way the Twins have been performing this and the last season.  Some of us have been frustrated even longer, since the Twins have last won a World Series in 1991.  That was 21 seasons ago.  Kids who were born then they can now buy booze.  Not good.

Anecdotally, there have been a lot of remarks and thoughts about the Twins trying to create cookie cutter pitchers, about Ron Anderson (who was named the pitching coach when Ron Gardenhire was named the manager in 2001) wanted everyone in the whole organization to throw the 2 seamer and pitch to contact.

But gut feelings and all, this blog is about substantiated evidence and numbers.  So here is what I did, and here is what I am presenting:  I looked at all pitchers who wore a Twins' uniform this Millennium and compared how they did while with the Twins vs. how they did after they left the Twins. I went as far as 2009-10 (but some of the latest losses have inconclusive numbers).

And here is the honor roll.  A list of 20 pitchers who did better after they left the Twins, when they were older, when they were past their prime.  Not one or two (like Jose Reyes who did phenomenally while with the Twins) but 20.  It cannot be a coincidence.   And I am not even including pitchers like Sergio Santos and Peter Moylan on whom the Twins gave up before they ever gave them a chance.

Here is Rick Anderson's (ok a couple are before his time) Honor Roll:

Luis Ayala:

Twins 2009 (age 31) : 4.18 ERA, 1.423 WHIP, 5.8 K/9, 2.63 K/BB (was cut)
Yankees 2011 (age 33) : 2.09 ERA, 1.268 WHIP, 6.3 K/9, 1.95 K/BB
Orioles 2012 (age 34) : 1.82 ERA, 1.054 WHIP, 5.1 K/9, 2.80 K/BB

Grand Balfour:

Twins (2001-2004 ages 23-26) : 4.63 ERA, 1.456 WHIP, 9.8 K/9, 1.95 K/BB
Rays (2007-2010 ages 29-32) : 3.33 ERA, 1.212 WHIP, 10.4 K/9, 2.6 K/BB
Athletics (2011-2012 ages 33-34) : 2.78 ERA, 1.145 WHIP, 8 K/9, 2.52 K/BB

Joe Beimel:

Twins (2004, age 27) : 43.20 ERA, 6 WHIP, 1.2 IP (was cut)
LA Dodgers (2006-2008, ages 29-31) 3.04 ERA, 1.336 WHIP, 4.9 K/8, 1.53 K/BB
Nationals (2009 age 32) 3.40 ERA, 1.336 WHIP, 5.4 K/8, 1.6 K/BB
Rockies (2009-10 ages 32-33) : 3.56 ERA, 1.385 WHIP, 4.7 K/9, 1.68 K/BB

Craig Breslow:

Twins 2008-9 (ages 27-28) : 2.89 ERA, 1.132 WHIP, 7.3 K/9, 1.72 K/BB (was cut)
Oakland 2009-11 (ages 28-30) : 3.14 ERA, 1.199 WHIP, 7.6 K/9, 2.34 K/BB
Arizona 2012 (age 31) : 2.13 ERA, 1.026 WHIP, 7.8 K/9, 2.2 K/BB


Jesse Crain:

Twins 2004-10 (ages 22-28) : 3.42 ERA, 1.257 WHIP, 6.2 K/9, 1.87 K/BB
White Sox 2011-12 (ages 29-30) : 2.37 ERA, 1.180 WHIP, 9.8 K/9, 2.42 K/BB

Jack Cressend:

Twins (2000-2001 ages 25-27) : 4.59 ERA, 1.480 WHIP, 6 K/9, 1.66 K/BB
Indians (2003-2004 ages 28-29) : 3.53 ERA, 1.381 WHIP, 5.5 K/9 1.89 K/BB


R.A. Dickey:

Twins: 2009 (age 34) : 4.62 ERA, 1.617 WHIP, 5.9 K/9, 1.4 K/BB
Mets: 2010-12 (ages 35-37) 3.08 ERA, 1.193 WHIP, 6 K/9, 2.65 K/BB

Willie Eyre:

Twins 2006 (age 27) : 5.31 ERA, 1.635 WHIP, 3.9 K/9, 1.18 K/BB
Texas 2007-9 (ages 28-30) : 5.02 ERA, 1.558 WHIP, 5.2 K/9, 1.32 K/BB
Baltimore 2011 (age 32) : 3.44 ERA, 0.927 WHIP, 4.9 K/9, 2 K/BB

Aaron Fultz:


Twins (2004, age 30) : 5.04 ERA, 1.460 WHIP, 6.7 K/9, 1.61 K/BB
Phillies (2005-6 ages 31-32) : 3.38 ERA, 1.239 WHIP, 7.3 K/9, 2.27 K/BB
Indians (2007, age 33) : 2.92 ERA, 1.324 WHIP, 6.8, 1.56 K/BB

Matt Garza:

Twins 2006-7 (ages 22-23) : 4.47 ERA, 1.602 WHIP, 7.1 K/9, 1.91 K/BB
Rays 2008-10 (ages 24-26) : 3.86 ERA, 1.251 WHIP, 7.1 K/9, 2.32 K/BB
Cubs 2011-12 (ages 27-28) : 3.51 ERA, 1.237 WHIP, 8.8 K/9, 3.00 K/BB

LaTroy Hawkins:

Twins: (SP/RP 1995-2003 ages 22-30): 5.05 ERA, 1.523 WHIP, 5.9 K/9, 1.83 K/BB
Twins: (RP: 2000-2003 ages 27-30): 3.09 ERA, 1.271 WHIP, 7.1 K/9, 2.31 K/BB
Cubs: (2004-2005 ages 31-32) : 2.76 ERA, 1.099 WHIP, 7.3 K/9, 3.9 K/BB

Livan Hernandez:


Twins 2008 (age 33) : 5.48 ERA, 1.632 WHIP, 3.5 K/9, 1.86 K/BB
Nationals 2009-11 (ages 34-36) 4.17 ERA, 1.363 WHIP, 5.0 K/9, 1.82 K/BB
Atlanta 2012 (age 37) : 3.68 ERA, 1.389 WHIP, 5.8 K/9, 2.38 K/BB

Phil Humber:

Twins 2008-9 (ages 25-26) : 6.10 ERA, 2.032 WHIP, 6.5 K/9, 1.07 K/BB
Royals 2010 (age 27) : 4.15 ERA, 1.338 WHIP, 6.6 K/9, 2.29 K/BB
White Sox 2011-12 (ages 28-29) : 4.14 ERA, 1.219 WHIP, 6.8 K/9, 2.55 K/BB

Mike Lincoln:


Twins (1999-2000 ages 24-25) : 7.70 ERA, 1.825 WHIP, 3.9 K/9, 1.08 K/BB
Pirates (2001-2003 ages 26-28) : 3.50 ERA, 1.362 WHIP, 6.2 K/9, 2 K/BB

Kyle Lohse:

Twins 2001-2006 (ages 22-27) : 4.88 ERA, 1.447 WHIP, 5.6 K/9, 1.94 K/BB
Reds 2006-2007 (ages 27-28) : 4.58 ERA, 1.361 WHIP, 6.1 K/9, 2.52 K/BB
Cardinals 2008-2012 (ages 29-33) : 4.18 ERA, 1.332 WHIP, 5.4 K/9, 2.33 K/BB

Jose Mijares:


Twins 2009-11 (ages 23-26) : 3.16 ERA, 1.315 WHIP, 6.9 K/9, 1.9 K/BB
Royals 2012 (age 27) : 2.49 ERA, 1.200 WHIP, 6.6 K/9, 4.0 K/BB

Mark Redman:
Twins (1999-2001 ages 25-27) : 4.86 ERA, 1.469 WHIP, 6.6 K/9, 2.21 K/BB
Detroit (2001-2002 ages 27-28) : 4.29 ERA, 1.307 WHIP, 4.8 K/9, 2.05 K/BB
Florida (2003 age 29) : 3.59 ERA, 1.222 WHIP, 7.1 K/9, 2.48 K/BB

JC Romero:

Twins: (1999-2005 ages 23-29) : 4.35 ERA, 1.482 WHIP, 7.4 K/9, 1.61 K/BB
Philies: (2007-2011 ages 31-35) : 2.73 ERA, 1.406 WHIP, 7.3 K/9, 1.14 K/BB

Brad Thomas:


Twins (2001-2004 ages 23-26) : 9.89 ERA, 2.155 WHIP, 3 K/9, 0.85 K/BB
Tigers (2010-2011 ages 32-33) : 4.59 ERA, 1.606 WHIP, 4.1 K/9, 1.06 K/BB


That is a lot of opportunity lost.   A lot of adverse results.  And this does not even include the current pitchers.  It is not one or two or 3.  Twenty.  The Twins can just not ignore this  any more...


10/24/11

A contrarian opinion about the Twins' Starting Pitching

It is hard to look back at a 99-loss season and try to figure out what did not work, but it is necessary to just do that and try to pinpoint possible weaknesses that need to be solved. With a 99-loss season, pretty much nothing worked well, but prioritizing changes requires the identification of parts of the team that can be fixed relatively easily or by fixing them, it will make the biggest impact.

A lot of people in Twins territory, including fans and the press, and the Twins' management, as was referenced in the season ticket holder press conference a few weeks ago, see starting pitching as one of the weaknesses of the 2011 team, which needs to be fixed this off-season.

I examined that hypothesis, by looking at the performance of the Twins' starters in 2011 based on their on-field numbers. And the numbers disagree with that generalized belief.

3 years ago I devised a compound statistic measurement that indicates pitching effectiveness. Here I explain the idea behind the pitching effectiveness (or PE) measurement, and why I prefer it as an indicator of pitching performance independent of fielding or other external factors than other compound statistic measurements like FIP, xFIP and DICE. PE is (K/9*K/BB)/WHIP. A couple years ago, I devised another measurement expected PE or xPE, which is PE*(BABIP/.290), to further neutralize for "luck", reflecting what a pitcher's PE would be if his BABIP was .290 (League normal.)

Here is a list of the Twins' starters ranked by xPE for their 2011 performance. For pitchers who both started and relieved in 2011, only their numbers as starters are taken into consideration for the calculations. Also, the Twins' team average starter numbers are indicated as are the league average numbers. For comparison purposes, the numbers of AL starting pitchers who are considered as "Aces" and had the best starting pitching performances in 2011 are also included:


I included the following color coding: MLB average is green, above average darker green, below average yellow and well below average red.

A few observations (and I am sure that this is surprising to many out there) :


  • The Twins' starter as a group, had better performance that the league average

  • One pitcher's performance (Kevin Slowey) was bettered only by Verlander, while another one's (Baker's) trailed only Verlander and Sabathia and was better than Felix Hernandez, Weaver, CJ Wilson and Lester

  • Liam Hendricks, who will probably be in AAA in the start of 2012 season, had 4 very promising starts

  • Brian Duensing and Anthony Swardak were right there with the league average

  • Pavano's and Liriano's performance was below par. Liriano was injured the whole season (and exhibited a 2mph velocity drop. His 2010 numbers (20.38 PE, 23.68 xPE) are promising for a comeback, especially if his shoulder heals and velocity increases. Pavano is a decent end of the rotation innings eater, but at this point should not be considered anything more than a 5th pitcher in this staff (and his is compensated more than that; so there is a decision that needs to be made.)

  • Blackburn and Diamond do not belong in a major league rotation.


Ok. I know that this sounds pretty crazy and counter intuitive. It is contrary to what most Twins' fans, the press and the organizational brass believes. But the numbers do not lie; however the dismal results do not lie either? How do we reconcile these opposing facts? In other words, what happened if the Twins' starters pitched well?

Here are a few things that happened:

  • The Twins' as a team had a ridiculous high BABIP (opponents' Batting Average in Balls In Play). 0.318 as a team. As a matter of fact, other than Liriano, every starter had an elevated BABIP, and Slowey's, Duensing's, Blackburn's, and Hendicks' approached ridiculous levels

  • The Twins' defence, especially infield defense was one of the MLB worse. Here are the UZR/150 for each position as a total and for individual players at that position:


    • 1B: 11.4 (Mauer 27.8 UZR150/141 inn, Morneau 11.3/479, Hughes 11.0/274, Parmelee 8.1/173, Cuddyer 6.4/352)

    • 2B: -6.0 (Tolbert 5.1/244, Hughes 4.9/301, Casilla 2.2/470, Dinkelman -2.9/89, Cuddyer -20.8/140, Nishioka -39.7/49, Plouffe -41.8/127)

    • 3B: -7.1 (Valencia -6.2/1280, Hughes -9/104, Tolbert -42.3/37)

    • SS: -13.6 (Tolbert -3.2/210, Casilla -4.4/306, Nishioka -14.2/508, Plouffe -25/396)

    • LF: 2.5 (Plouffe 35.8/19, Repko 13.3/128, Benson 9.1/88, Young 5.4/642, Revere -3.1/112, Tosoni -3.8/321, Kubel -4.2/70, Dinkelman -18.2/40)

    • CF: 14.2 (Span 17.6/585, Revere 15.1/776, Benson 9.5/17, Repko -61.6/43)

    • RF: -1.8 (Revere 63.6/37, Repko 21.7/157, Dinkelman 6.3/22, Cuddyer 0.1/639, Benson -5.9/59, Mauer -8.3/9, Kubel -8.3/413, Plouffe -51.4/72, Tosoni -55.1/11)


    This deserves a whole post by itself, but I am just presenting the numbers at this point

  • The best pitchers did not pitch the most, because of injuries and because of bad choices by the manager and the coaches.

  • The bullpen was atrocious (and that's another story by itself), allowing a lot of inherited runs to score (inflating starters' ERAs) and losing leads


So how the Twins' starting pitching should look at 2012? What changes can be made and give better results?

  • Get everyone healthy. First and foremost. With a healthy, and presumed back to at least his 2010 form, Liriano, this team has 3 true strong pitchers.

  • Give the ball to your best pitchers. There is no way any other team would have alienated their best starter as this team has alienated Slowey. It is silly to have your best starter in the pen and give the ball to Blackburn (who does not belong in a major league rotation) because you gave him an ill-advised contract extension

  • Realize the fact that Pavano is a back of the rotation pitcher and do not treat him like an Ace. Either have him at number 4 or 5 or trade him to relief the team from that contract

  • Fix the defense. This is a no-brainer (and will get it's own post one of these days.) Also find some ways to score runs. This is another no-brainer and will get it's own post

  • The writing on the wall is that Hendricks will be heading to Rochester and Duensing to the bullpen. Hendricks can use some AAA time and I think that with Cole DeVries, who has been transitioning to a starter in AFL and has been pretty effective in 4 starts there, will form a good reserve corps at the AAA level. Duensing, despite what a lot of people think, has been a reliable league average starter. He can be a stellar reliever and could really help fix the bullpen.

  • Deal with Blackburn and Diamond. Blackburn (much like Perkins) has not been an effective starter in his Twins' tenure (ill-advised contract extension or not.) Putting him in the pen and hoping for same results as with Perkins is the best course of action. Diamond is not ready and needs to be in AAA and should not be the first option, if a starter is needed


So with these changes we are looking for a 2012 Twins' rotation of Slowey, Baker, Liriano, Swarzak and Pavano (or Duensing/Hendricks, if Pavano is traded.) I believe (and the numbers suggest) that this group can be successful in 2012 with better health, better management, better fielding and better defense. Despite what most people feel, the Twins' starting rotation was one of the (few) team's strengths in 2011.

What do you think?

6/28/10

Thoughts about the Twins rotation

The Twins have just finished their annual interleague series, with results that did not fulfill expectations, posting an overall losing record, for the first time since 2005. This fact, in addition to an 11-game winning streak by the White Sox and a decent interleague performance by the Tigers, which brought these 2 teams one-and-a-half and half a game respectively, behind the Twins in the standing, has triggered a lot of speculation about the team with most fingers pointing towards the starting rotation. Trade speculation that will bring in pitchers like Cliff Lee and Roy Oswalt to the Twins has been rampart, and in the national media as well.

I am attempting to examine the performance of the Twins starting pitchers, compare it to that of a few pitchers, including Lee's and Oswalt's, and will share my thoughts.

I will use 2 criteria to look at pitching performance:

  • Expected Fielding Independent Pitching (xFIP)

  • and
  • Expected Pitching Efficiency (xPE). I do like (and prefer) using PE, (K/9*K/BB)/WHIP, and xPE, PE*(BABIP/.295), as pitching performance indicators, but I am adding the more widely used xFIP


Here is the performance of Twins' starters, the AL average starters and a couple of other pitchers, including some historic data:


  • Clearly (esp, as far as xPE is concerned, and xFIP pretty much agrees), the Twins have four above average pitchers in their rotation, and a fifth, Nick Blackburn, which is pitching at about replacement level. A quick look at the BABIP of the Twins' pitchers, will show that, with the exception of Pavano, it has been extremely high, and it is due for a correction that would result in more success, in terms of ERA and W-L, for the Twins starters. However, Blackburn's peripherals, esp. K/9 and K/BB are extremely low to make him a league average pitcher, even with the BABIP correction. I have criticized the contract extension and my reasoning was that (because of his conditionally low PE) he projects as a number 5 starter in a competitive team, and you do not lock your number five starter long term.

  • Replacing Blackburn in the rotation, is pretty much imperative at this point. One of the arguments for bringing in Lee or Oswalt is that "the Twins lack a true Ace" and the newcomer will be that ace for the Twins' run in the post-season. If you look at Liriano's performance, both as far as xPE and (mostly) as far as xFIP is concerned, he is an Ace. His performance has been better than that of Johan Santana's in his last year with the Twins and that of both Lee (his 2010 xPE is off the charts, because of low BB/9) and Oswalt in both of their last 2 season. So, myth debunked: The Twins do have an ace, and his name is Fransisco Liriano.


  • I think that unless Lee divides the clubhouse (and there have been a lot of questions about both his clubhouse presence and his character, and some indications of that were obvious to the Twins' fans with the infamous Gomez incident in 2008), I think that he will be a worthwhile addition, paired with Fransisco Liriano (a fellow lefty) on the top of the rotation. What will it take to pry Lee from the Mariners. There was a report that a trade was made involving Ramos, Duensing and an outfield prospect, which fell through because of Ramos oblique injury. I do not believe this trade rumor, mainly because it will be overpaying for the Twins. I think that Ramos will be the centerpiece in any package. Reportedly, Seattle wants "young outfielders" (is it because the Twins have many of those?) in addition to a young catcher. The Twins could really fit that bill with players like Benson and Roberts, but adding players like Hicks, Revere and Angel Morales will be overpaying. Personally I would like to see both Glen Perkins and Nick Blackburn go to the Mariners (the Twins might have to pay some of Blackburn's ill-advised contract), because it will be win-win situation for anyone involved: The Twins open 3 spots (Ramos' as well) on their 40-man roster, enabling them to add players like Waldrop and Slama, and a spot on the 25-man roster. The Mariners get two pitchers who had relative success in the majors in the past and they can resurrect their careers in a new environment in the Mariners' large ballpark.

  • Oswalt on the other hand, would be better than Blackburn (not a tall order, Duensing will be better than Blackburn at this point) but not a top of the rotation starter. He never pitched in the AL before and all pitchers that made the NL to AL move later in their careers have not been able to translate NL success to AL success.

  • How about Slowey? Disappointing season so far. In the last 3 games his velocity fell by about 2 mph (both average FB velocity and max FB velocity). I hope that he is not having injury problems and it is an adjustment that he is making that results in the decreased velocity. To be noted: Opponents hit for a 1.208 OPS off Slowey (and 1.341 OPS off Blackburn) when paired with Drew Butera vs. a .780 OPS off Slowey (and .953 off Blackburn) when paired with Joe Mauer. Slowey should always pitch at Mauer. Gardenhire, could adjusts Mauer's days off to coincide with the pitching days of Pavano (.663 oOPS with Mauer and .601 oOPS with Butera) or even Baker (.845 oOPS with Mauer and .740 oOPS with Butera.) There is no reason that Butera should not be Pavano's "personal catcher". That concept (the back up catcher catching one pitcher who has been successful with him as a catcher, unless there are injuries) has been a very wide spread practice and should be applied in this situation. I have been calling for Butera to go to AAA and be replaced by Morales since Morales was healthy, but it seems that there is a mis-understanding between Gardenhire and Morales at this point... Regardless, Butera has no business catching Slowey.

  • The Twins are starting a critical 3 game series at home against Detroit today. Sweeping Detroit might make things a lot better, but, still, some changes (replacing Blackburn and selective use of Butera) should be in the Twins' future, as far as the starting rotation is concerned....

8/27/09

Would Brad Penny be an improvement?

Joe Christensen in his blog mentioned that the Twins might pick Brad Penny from the release waiver wire. Let's examine whether he will be an improvement over the Twins' current starters.

To analyze this, I will be using the same methodology I used here, looking at PE and xPE:


For Pavano's numbers I am using only his Twins' appearances. Gabino's sample is not significant.

Clearly from the current starters (with Liriano in the DL), Brad Penny would rank third in the Twins' staff behind Baker and Pavano. A low risk high reward pick up that might help the Twins in their pennant run and would be more effective that Blackburn, Duensing, and Swarzak. Dave Cameron agrees with this line of thinking at FanGraphs, using different statistic criteria.

On another note, Carl Pavano and Brad Penny were the #1 and #2 starters for the 2003 World Champion Florida Marlins. Mike Redmond was the back-up catcher in that team.

8/3/09

The state of the Twins pitching and trade possibilities

The general consensus is that the Achilles heel of the Twins this season has been pitching, both starters and relievers. The Front Office had tried to help the team by targeting certain pitchers before the non-waiver trading deadline, but these efforts were fruitless, probably due to the fact that most contenders this season were looking for pitching and it was a sellers market. The Twins were able to fill a lesser need, acquiring Orlando Cabrera from the Oakland Athletics for Tyler Ladendorf, a move which I analyzed here. Now the trading deadline is long passed and the Twins could add to the club through waiver trades. As a matter of fact, the Twins are in an advantage over the other American League contenders because they have the worse record of the bunch, which results in the Twins having priority on waiver calls for players placed on waivers by other American League teams. Unfortunately, unless an National League player passes through waivers, the Twins will probably not be able to add an NL player through a claim, since all National League clubs, including the Dodgers, who have the best record in the majors have priority over the AL Clubs on players waived by NL teams.

Here I will attempt to do two things:

  1. Using objective criteria look at the current state of Twins' pitching

  2. Using the same criteria look at possible targets who might improve the Twins' pitching in the stretch run


The objective criteria I am using is Pitching Efficiency or PE, defined as: (K/9*K/BB)/WHIP and a newly devised metric, expected PE or xPE, defined as PE*(BABIP/.290). A few words about xPE: xPE is the expected pitching efficiency if a pitcher had balls in play batter for an average of .290; in other words, trying to take "bad luck" out of the equation.

With no further ado, and because a picture (or a table) is worth more than a thousand words (add your favorite cliche), here is a table that shows each Twins' pitcher's PE and xPE in 2009 (and its components). Also the team average and the AL average, as well as the AL average for starters and the AL average for relievers are also shown. (The same table shows potential targets' metrics, but I will talk about them later) Twins' pitchers' metics better than the AL average for starters or relievers (in any individual metric) are in bold, starters with PE or xPE better than the AL average are highlighted in yellow and relievers with PE or xPE better than the AL average are highlighed in green:


Here are my conclusions:

  • Surprising the overall team pitching looks better than the AL average; the reason for this is that 2 starters (Slowey and Baker) and 2 relievers (Nathan and Guerrier) are much higher than the AL average

  • Looking at the starters, there were only 3 starters higher than the AL starter average, Slowey, Baker, Liriano; but, unfortunately, the Twins has lost their best starter for most (or all) of the season

  • Looking at the relievers, there were only 3 relievers higher than the AL reliever average, Nathan, Guerrier, Ayala; but, unfortunately, personality clashes with the coaching staff and the manager, resulted to the release of the Twins third-best reliever

  • Perkins, Swarzak and Blackburn trail by far (in best to worse order) the AL starter average (about a month ago at a point where several have anointed him "the ace" or the "stopper", I indicated that Blackburn was living on the edge based on his PE, and his latest ineffectiveness did not surprise me)

  • Mijares, Crain, Dickey, Keppel and Duensing trail by far (in best to worse order) the AL reliever average. Keppel and Duensing are very close to replacement level and are much worse that the pitchers they replaced (Ayala and Breslow/Henn)


Is there hope?

Of course, there is always hope; however, lets look at who could potentially help the Twins, instead of being existentialistic or fatalistic.

Today Joe Heyman in Sports Illustrated posted 3 lists of players:

  1. Players who are likely to pass through waivers

  2. Players who might pass through waivers

  3. Players who will not pass through waivers, but a trade could be made by the claiming team


I did the following:

  • Took the pitcher's from Heyman's lists, with the exceptions of NL pitchers in his last (#3) category and pitcher like Roy Halladay and Felix Hernandez, for whom the Twins are extremely unlike to work a trade

  • Calculated their PE and xPE and listed it on the table above (broken down by Heyman's 3 categories)

  • As with the Twins' pitchers earlier, every metric higher than the AL average corresponding to a starter or a reliever is on bold, if a starter has higher PE and/or xPE than the AL average for starters he is highlighted in yellow and if a reliever has a higher PE and/or xPE than the AL average for relievers, he is highlighted in green


The result is only 5 names, 2 starters and 3 relievers from Heyman's list, are better than the AL Average in their respective functions. Let's examine then:


  • Aaron Harang. Despite the fact that he is playing for an NL team (the Reds), his numbers are good enough to translate into a legitimate above average pitcher in the AL. For 2009 his contract is $11 million (about $4.5 million left), he is under contract for $12.5 million in 2010 and there is club option for $12.75 million in 2011 (with a $2 million buyout). I think that if he passes waivers, as Heyman suggests, with the Reds are looking to reduce payroll after the Rolen acquisition, if the Twins are willing to spend $19 million for the next 2 years, he might be part of the solution

  • Ron Mahay. He barely made that list because of his high BABIP this season. He plays for an AL Central team (Royals). The Twins do not trade within the division. Is he better than Mijares? Maybe. Is he better than Duensing? Yes. Will it happen. No.

  • Carl Pavano. The man who was once traded (by the Red Sox to the Expos) for Pedro Martinez is on a very nice rebound this season. He is on an one year contract with about $600,000 left, which is great. Unfortunately he is pitching for the Indians and as long as the Twins' are not trading within the division, it is not happening.

  • Mike Wuertz. He is on a tear. The Twins' tried to trade for him with the A's and it did not work out before the deadline. Now that the Twins are in an advantage as far as AL-waiver claims go (because having the worst record among the contenders, they can claim him before anyone else), it will be interesting to see whether they could work a trade with the As. Wuertz (who btw is from Austin, the home of SPAM, not Texas) is under team control for 2009 and 2010, arbitration-eligible for 2010 and is owed about $400,000 for the rest of the season. The issue here is whether the Twins might be willing to give up someone like Anthony Slama and a lower level prospect for him, because that will probably be what it takes (As PTBNL) to get Wuertz in his home state Twins' uniform, give or take. He could also be part of the solution

  • Jason Frasor. A lot of the things that I said earlier about Wuetz, apply to Frazor, other than the facts that Frazor is not effective as Wuertz this year, he is from the land of Lincoln (the president, not the car), he pitches for the Blue Jays and he is a free agent after this season (he has about $500,000 remaining in his contract). And, yes, he will be cheaper. Will the Twins decide to give Rene Tosoni (a Canadian OF) to the Jays and a lower prospect as PTBNL? We'll see, but he can also be part of the solution


So here it is: Best case scenario: Aaron Harang, Mike Wuertz and Jason Frazor. Worse case scenario: Do nothing. Realistic scenario: We'll see, but I think that it will fall in-between those two extremes...

6/17/09

Has the Twins' pitching improved? (Or why ERA and WHIP tell only part of the story)

The general consensus among Twins' fans, media and organizational personnel has been that the past 2 months the pitching (both the rotation and the bullpen) have been inconsistent and recently improved greatly. Let's see how numbers support this empirical observation.

Here is the Twins' starters and reliever's ERA month by month:


Here is the Twins' starters and reliever's WHIP month by month:


This looks a bit surprising. Yes the starters were pretty bad in April and May, but it looks, using traditional measurements, that the pen had turned the corner in May before becoming really good in June. Sub 3.50 ERA and WHIP around 1.250 is pretty good? Isn't it? That surely conflicts with the empirical observation that the pen was not that great in May. Who is to believe? Your eyes or the numbers? That bullpen surely surrendered leads in May.

As I explained last November there are just not many good measurements to describe and evaluate the state of pitching, and this is why I created the "Pitching Efficiency" measurement (PE= (K/9*K/BB)/WHIP).

Here is the Twins' starters and reliever's PE month by month:


I would argue that looking at PE, supports the empirical opinion that:

  • The Bullpen was pretty bad both in April and May

  • The pen was worse overall than the rotation

  • They both have turned the corner in July


  • The 2008 MLB average PE for starters was 9.19 and for relievers 10.89. So the rotation has been pretty average as a unit but the pen below average. The July numbers are phenomenal: 21.45 for the rotation and 28.57 for the bullpen. To give some points of reference, in 2008 Roy Oswalt had a PE of 21.19 and Brad Lidge a PE of 25.61. Not bad.

    The next plot would try to kill two birds with one stone: Why are the pen ERA and WHIP in April so misleading and is July sustainable? ERA is not a great measure of pitching ability, but one would think that WHIP will be able to describe what is going one pretty well. Apparently not so and here is the reason:

    Here is the Twins' starters and reliever's BABIP month by month:


    BABIP is batting average on balls in play (excludes home runs, HBP, K and BB). It should normalize at about .290 to .300. In April the Twins pitchers had a higher than normal BABIP (reflected in the higher that expected WHIP) and in May a lower than normal BABIP (reflected in the lower than expected WHIP).

    The good news is that both the rotation and pen BABIP have been stable at close to normal levels so I expect the success to continue. One might argue that Swarzak was a big part of this change in June. However, looking at individual PEs Swarzak's year to day is 7.94 and Perkins' (excluding last nights game) 8.22, thus, I suspect that it will not matter that much.

    Whose numbers are inflated and whose are deflated based on PE? Here are the individual PEs (ranked high to low) for the Twins pitchers:

    Starters

    Baker: 34.47
    Slowey: 30.80
    Liriano: 9.32
    Perkins: 8.23
    Swarzak: 7.94
    Blackburn: 4.61

    Relievers

    Nathan: 54.79
    Guerrier: 26.57
    Henn: 14.46
    Ayala: 13.41
    Dickey: 7.84
    Mijares: 7.81
    Breslow: 4.50
    Crain: 3.70


    Surprised? Baker is close to breaking through (and his last 2-3 starts indicate that) and Blackburn is living on the edge by giving too many hits, walking more batters than usual and striking out fewer than usual. Also, Mijares, mainly because his occasional lack of command that results to a high numbers of walks (the same problem that Breslow and Crain had, but in lesser degree than those two), might be walking on thin ice. On the other hand, Guerrier has been exceptional, Henn surprising and Ayala has been pitching better than his "traditional numbers" indicate.

    5/4/09

    Pitching and the seventh-inning stretch

    The seventh-inning stretch has been a long tradition in baseball, legendarily attributed to President Taft. During the middle of the 7th innings, the fans are standing up in the stands and signing take me out to the ball game.

    However, the Twins pitchers this season, so far are creating a different version of the seventh inning stretch, practically begging to be taken out off the ball game.

    Here is the Twins' opponent OPS at the different innings (10 is all extra innings):

    1/22/09

    Rumors, rumors and a break in the inactivity with some theoretical stuff

    There have been several rumors these days linking the Twins to reliever free agents Russ Springer and Eric Gagne (unlike the former Twin Greg Gagne he kept the French pronunciation, as in the Minnesota pro-wrestler family; see: Gagne, Verne et. al.) and Joe Crede (and even Dan Uggla, to my delight). I am not really going to propagate those rumors or discuss them until (or if) someone is actually signed, when I will do an analysis of the signing.

    Here is today's subject:

    What should be the optimal balance of pitching and position players in a 25-man roster for the Twins to improve?

    Last season, the Twins went with a 12 man pitching staff (for a while 13). I think that this worked to their disadvantage. Here is my train of thought:

    I think that the ideal bullpen should be six. Here is my reasoning:

    Assume 1460 innings pitched by the whole Twins' staff (the amount the Twins pitchers pitched in 2008)

    If every starter pitches 6.3 innings, 4 will pitch 33 games and the fifth 30. Starters will take care of 1021 innings this way.

    The pen would be responsible for 439 innings. Nathan averaged 70 innings in each of his years with the Twins. So the remaining 5 pitchers will be responsible for 369 innings. If the long man gets 90 innings (a reasonable average for mop up pitching) the remaining 4 would be responsible for 279 innings or 69.7 innings per pitcher which is very doable.

    What would this require?

    a. other than the mop up man, 4 good relievers that can get opposing hitters out no matter whether they are lefties or righties.

    and

    b. Gardy to quit bringing up pitchers just for one batter. This wastes pitchers.

    How doable is it?

    Let's assume than Nathan is the closer and Humber the long man.

    Opponents OPS:

    (the MLB average for relievers is .726)

    Bonser RHB: .715 (fine) LHB .866 (not good)
    Breslow RHB: .563 (great) LHB .462 (great)
    Crain RHB .755 (so so) LHB .719 (fine)
    Mijares (small sample warning) RHB .150 (super), LHB .286 (super)
    Guerrier RHB .802 (not good) LHB .801 (not good)

    Remember, only 4 of these 5 will be in. If Guerrier is out and another good reliever comes in (or if Guerrier resurrects himself) relegating Bonser to the long man position and Humber out, it is very doable.

    just for fun,

    Springer's numbers: RHB .456 (super) LHB .848 (ouch).
    (no, folks, he ain't the one)

    The flexibility that an extra position player will provide, esp. with the infield questions is probably better than the luxury of using pitchers just for one batter.

    Still don't believe me?

    Here are some more data from last season:

    Team OPS in the 8th inning: .697, in the 9th .708 and in extra innings .668 (not good; Twins' overall OPS .748, AL overall OPS .756).

    Twins' Team OPS for PH .803

    I think that this little piece of data makes the case for an extra person on the bench as a PH in late innings stronger.

    what do you think?


    Remember the off-season contest is still on. Go to the link and give me your thoughts. 2 people did already. If 2 more do, you are all guaranteed to win a copy of one of the best minor league publications for the Twins, the Minnesota Twins Prospect Handbook - 2009, by Seth Stohs of SethSpeaks.net a major authority in the Twins' blogosphere, personally autographed by Seth himself.

    So just do it, as the Nike marketers once said

    6/24/08

    And yet, there is more

    For the sake of completeness, here are the road splits for every MLB team, ranked by decreased home to road era (the differential in parenthesis) along with their home stadium factor (the second parenthesis):

    Pittsburgh 2008: Home ERA 3.75, Road ERA 6.59 (+2.84) (98)
    Twins 2008: Home ERA 3.32, Road ERA 5.69 (+2.37) (96)
    Tampa 2008: Home ERA 2.87, Road ERA 5.05 (+2.18) (100)
    San Diego 2008: Home ERA 3.38, Road ERA 5.10 (+1.72) (91)
    Milwaukee 2008: Home ERA 3.36, Road ERA 4.95 (+1.59) (101)
    Dodgers 2008: Home ERA 3.35, Road ERA 4.51 (+1.19) (105)
    Cleveland 2008: Home ERA 3.57, Road ERA 4.75 (+1.18) (102)
    Oakland 2008: Home ERA 3.01, Road ERA 4.02 (+1.01) (93)
    Mets 2008: Home ERA 3.57, Road ERA 4.58 (+1.01) (96)
    Boston 2008: Home ERA 3.45, Road ERA 4.27 (+.82) (105)
    Reds 2008: Home ERA 4.05, Road ERA 4.85 (+.80) (105)
    Toronto 2008: Home ERA 3.24, Road ERA 3.95 (+.71) (99)
    Colorado 2008: Home ERA 4.35, Road ERA 4.97 (+.62) (108)
    MLB 2008: Home ERA 3.89, Road ERA 4.48 (+.59) (100)
    Kansas City 2008: Home ERA 4.20, Road ERA 4.75 (+.55) (104)
    Seattle 2008: Home ERA 4.41, Road ERA 4.95 (+.54) (96)
    Cubs 2008: Home ERA 3.44, Road ERA 3.92 (+.48) (105)
    Atlanta 2008: Home ERA 3.52, Road ERA 3.98 (+.46) (96)
    White Sox 2008: Home ERA 3.31, Road ERA 3.70 (+.39) (105)
    Philadelphia 2008: Home ERA 3.71, Road ERA 4.04 (+.33) (104)
    Baltimore 2008: Home ERA 4.20, Road ERA 4.47 (+.27) (102)
    Marlins 2008: Home ERA 4.37, Road ERA 4.55 (+.18) (97)
    Detroit 2008: Home ERA 4.53, Road ERA 4.59 (+.06) (101)
    Texas 2008: Home ERA 4.96, Road ERA 4.92 (+.04) (100)
    Yankees 2008: Home ERA 4.13, Road ERA 4.10 (-.03) (99)
    Giants 2008: Home ERA 4.45, Road ERA 4.36 (-.11) (100)
    St Louis 2008: Home ERA 4.16, Road ERA 3.89 (-.27) (99)
    Nationals 2008: Home ERA 4.80, Road ERA 4.41 (-.39) (100)
    Houston 2008: Home ERA 4.95, Road ERA 4.20 (-.75) (99)
    Arizona 2008: Home ERA 4.32, Road ERA 3.45 (-1.13) (106)
    Angels 2008: Home ERA 4.44, Road ERA 3.21 (-1.23) (100)

    What is clear from this is that, surprisingly, there is no correlation between home/road ERA differential and park factor of the home park. There are 3 teams, Pittsburgh, the Twins and Tampa Bay, which have really bad home/road ERA differentials this year. It's all about planning, managing and coaching. The current Pittsburgh and Tampa Bay managers and coaches have been regarded as 'not that great'; however, the Twins manager, has been regarded as 'one of the best in the game'. Who lies? numbers or opinions?

    Even more about pitching

    The 4 game differential in the previous post is somewhat high level and I wanted to get a bit more granular to increase the accuracy of the statistical argument.

    Here are the home road splits posted previously:

    Joe Nathan: Home ERA 0.86,Road ERA 2.79
    Dennys Reyes: Home ERA 1.32,Road ERA 4.00
    Matt Guerrier: Home ERA 1.46, Road ERA 5.74
    Jesse Crain: Home ERA 1.47, Road ERA 4.72
    Nick Blackburn: Home ERA 2.20, Road ERA 5.06
    Scott Baker: Home ERA 2.28,Road ERA 4.60
    Brian Bass: Home ERA 3.20, Road ERA 6.95
    Livan Hernandez: Home ERA 3.86, Road ERA 7.0
    Boof Bonser: Home ERA 5.73,Road ERA 8.55

    additionally pitchers not currently with the team are:

    Juan Rincon: Home ERA 3.68,Road ERA 8.78
    Pat Neshek: Home ERA 1.29,Road ERA 8.53
    Bobby Korecky: Home ERA 6.00,Road ERA 2.45
    Francisco Liriano: Home ERA 5.40,Road ERA 16.88

    by subtracting road from home era, subtracting the differential between the league average Home ERA 3.89, Road ERA 4.48 (.59) and dividing by 9 to get runs per inning pitched that the team would have gained if the Twins' pitchers were pitching on the road with the same effectiveness that the league average pitcher does, based on home ERA:

    Joe Nathan: 0.15 R/IP
    Dennys Reyes: 0.23 R/IP
    Matt Guerrier: 0.41 R/IP
    Jesse Crain: 0.30 R/IP
    Nick Blackburn: 0.25 R/IP
    Scott Baker: 0.19 R/IP
    Brian Bass: 0.35 R/IP
    Livan Hernandez: 0.28 R/IP
    Boof Bonser: 0.25 R/IP
    Juan Rincon: 0.50 R/IP
    Pat Neshek: 0.74 R/IP
    Francisco Liriano: 1.21 R/IP


    Looking at the Twins road losses and adjusting the score based on the above numbers (i.e. if Livan Hernandez pitched 5 innings and Brian Bass 4, in a hypothetical 5-0 loss, the adjusted score would be 5-(0.28*5 )-(0.35*4)= 2-0. To make it fair to the particular game, if a pitcher did not allow any runs, his differential will not be counted. Here is a list of those road losses, the original score and the adjusted score, along with win loss differential for the Twins and other AL Central teams:

    Apr 7 @CHW act: L 4-7 adj: L 4-5
    Apr 13 @KCR act: L 1-5 adj: W 1-0 diff +1 Twins -1 KC
    Apr 14 @DET act: L 9-11 adj: W 9-8 diff +2 Twins -1 KC -1 Det
    Apr 15 @DET act: L 5-6 adj: W 5-4 diff +3 Twins -1 KC -2 Det
    Apr 23 @OAK act: L 0-3 adj: L 0-1 diff +3 Twins -1 KC -2 Det
    Apr 24 @OAK act: L 2-11 adj: L 2-9 diff +3 Twins -1 KC -2 Det
    Apr 25 @TEX act: L 5-6 adj: W 5-4 diff +4 Twins -1 KC -2 Det
    Apr 27 @TEX act: L 0-10 adj: L 0-8 diff +4 Twins -1 KC -2 Det
    May 6 @CHW act: L 1-7 adj: L 1-5 diff +4 Twins -1 KC -2 Det
    May 8 @CHW act: L 2-6 adj: L 1-4 diff +4 Twins -1 KC -2 Det
    May 17 @COL act: L 2-3 adj: W 2-1 diff +5 Twins -1 KC -2 Det
    May 18 @COL act: L 2-6 adj: L 2-6 diff +5 Twins -1 KC -2 Det
    May 24 @DET act: L 3-19 adj: L 3-16 diff +5 Twins -1 KC -2 Det
    Jun 6 @CHW act: L 6-10 adj: L 6-8 diff +5 Twins -1 KC -2 Det
    Jun 7 @CHW act: L 2-11 adj: L 2-9 diff +5 Twins -1 KC -2 Det
    Jun 8 @CHW act: L 2-12 adj: L 2-11 diff +5 Twins -1 KC -2 Det
    Jun 9 @CHW act: L 5-7 adj: L 5-7 diff +5 Twins -1 KC -2 Det
    Jun 10 @CLE act: L 0-1 adj: L 0-0 diff +5 Twins -1 KC -2 Det (assume loss)
    Jun 12 @CLE act: L 2-12 adj: L 2-10 diff +5 Twins -1 KC -2 Det
    Jun 15 @MIL act: L 2-4 adj: L 2-4 diff +5 Twins -1 KC -2 Det

    According to this, the Twins record should have been 45-31 (a .592 winning percentage that projects to 96 wins for the season). If the pitching preparation problems were fixed, they type of discussions that are happening today wouldn't be happening... It is still early. There are 86 games left in the season. If the team identifies the problems, adjusts and plays the remaining 86 games at the potential .592 rate, it will finish the season with 91 wins, easily on top of the AL Central. The team management should really focus on this vs. adding bats...

    Digging more into pitching this year...

    The huge discrepancy in home and road ERAs, posted earlier, really took me by surprise and made me dig a bit deeper. I have been suggesting (screaming actually) that the numbers indicate that problem with this team this year is pitching, esp starting pitching and not batting. All the trade talk about adding 'better' bats and the talk about players like Lamb, Monroe and Everett underachieving, and who should the utility player be, in order for the Twins to win, are really moot points. I even wrote the following in Joe C's blog:

    This team can and should contend. Starting pitching has been a problem and the most serious problem in this team. Having discussions about whether one of Punto/Tolbert/Macri/Harris should play, is somewhat atopic, because either way the way the team has been performing this year, it would not make a difference. Looking at the bench vs. starting pitching is like looking at someone with a heart failure, and trying to give him/her a pedicure before resuscitating him/her… (extreme hyperbole, but I’m trying to make a point… That’s why I think that Gardy messing around with the line up is like an old lady at the checkout counter arguing whether she was shorted 3 cents, while someone is pickpocketing her purse…)


    I think that the previous analysis showed that the root cause of the pitching problems is bad road pitching. What is the root cause of bad road pitching?

    The players are the same, their stuff is the same at home and on the road. Just the preparation is different and this, as I said before, falls on the manager, the pitching coach and the travel staff. The team should look more serious into this big problem that is costing 2 runs for every away game.

    I'll come back to the last point later, but here are the numbers for the major leagues this year, making sure that there is not a league-wide aberration

    MLB 2008: Home ERA 3.89, Road ERA 4.48
    AL 2008: Home ERA 3.81, Road ERA 4.45
    NL 2008: Home ERA 3.96, Road ERA 4.52

    and here are the historic numbers for the Twins

    Twins:
    2008: Home ERA 3.32, Road ERA 5.69
    2007: Home ERA 3.84, Road ERA 4.54
    2006: Home ERA 3.40, Road ERA 4.54
    ----
    2005: Home ERA 3.62, Road ERA 3.83
    2004: Home ERA 3.89, Road ERA 4.20
    2003: Home ERA 4.50, Road ERA 4.31
    2002: Home ERA 3.76, Road ERA 4.52
    2001: Home ERA 4.47, Road ERA 4.56
    2000: Home ERA 5.18, Road ERA 5.13
    1999: Home ERA 5.08, Road ERA 4.97
    1998: Home ERA 4.52, Road ERA 5.00
    1997: Home ERA 4.94, Road ERA 5.10
    1996: Home ERA 5.38, Road ERA 5.22
    1995: Home ERA 5.74, Road ERA 5.81
    1994: Home ERA 5.26, Road ERA 6.17
    1993: Home ERA 4.73, Road ERA 4.73
    1992: Home ERA 3.68, Road ERA 3.76
    1991: Home ERA 3.90, Road ERA 3.48
    1990: Home ERA 4.24, Road ERA 4.03

    Up until and including 2005, the Twins' splits were comparable with the league. Ron Gardenhire and Rick Anderson came to the team in 2002. Rick Stelmaszyk has been the bullpen coach all those years, so his presence probably has nothing to do with this. Did something change between 2005 and 2006? Where any changes made in the travel routine this year? The one thing that changed in 2006 was that this was the first year the majority of the Twins pitching staff had the Gardenhire/Anderson combination as their only Twins MLB coaching/manager combination. Arguable, a veteran pitcher that learned travel habits and preparation that work for him from other coaches, a change in coaching stuff and road preparation philosophy will be less affected than a younger pitcher who has seen nothing else in the Twins' organization. Could it really be just Gardy's and Ronnie's fault?

    If the Twins followed the ML trend, their road ERA should have been 3.91. Instead it is 5.69. This is the equivalent of starting every road game down 2-0. Looking closely to the road games this year, if the manager and coaching stuff had the team prepared like every other ballclub in the majors this year, the following games would statistically have been wins:

    Apr 15 @DET L 5-6
    Apr 25 @TEX L 5-6
    May 17 @COL L 2-3
    Jun 10 @CLE L 0-1


    And the club record would have been 44-32, 2.5 games ahead in Central and 0.5 game off the WC race.

    The numbers clearly show that the issue with pitching is not personnel but preparation, managing and coaching. Is the management of the team aware of this issue? I would think that they have someone who analyzes the team performance and reports such obvious discrepancies. If the team straightens things out with the above problems, it would be the equivalent of adding 2 great pitchers in the rotation... If not, Gardenhire and his coaches should be held accountable, unless the management of this team would like to continue its pickpocketing at the rate of 2 runs a game.