For a while I wanted to take a bit of a formalized look at the Twins' pitching this season to see what we have learned and see what would make sense for the team to do in the future. Also, it has been a while since I took a formalized look at Twins pitching, so it was about time.
The metrics I like to use to do this have been some simple things of my own device: Pitching Effectiveness or PE and Expected Pitching Effectiveness or xPE. I fiddled around with PE in 2008 and with xPE in 2009.
Here is the reason I devised PE and
here is the reason I optimized it to xPE. My main arguments were a. I felt like xFIP and FIP and DICE weigh too much things like home runs (which anyone who watched the home runs by Miquel Cabrera and Delmon Young against the Twins yesterday cannot deny that they are a matter of inches and ballpark and luck and fielding performance from being a long fly ball). Also these formulae are hard to memorize and I wanted something simple I can calculate looking at a stat sheet and also something that you can calculate using splits (e.g. how has Brian Duensing or Glen Perkins been as a starter vs as a reliever); you can find xFIP around, but not in a spit form. So in 2008 I devised PE, which simple takes account three things: Strikeouts, walks and hits. So a pitcher who strikes out more people, walks fewer and gives lesser hits is more likely to succeed than someone who doesn't. And all hits are counted equal because the difference between a single and a triple might be the difference of having Delmon Young or Ben Revere play Left Field or the difference between a fly ball out and a home run might be the difference of having Torii Hunter or Rich Becker playing Center Field. And I use WHIP, K/9 and K/BB to calculate PE (a simple PE= (K/9*K/BB)/WHIP). xPE further normalizes for BABIP (to league average .290) to account for "luck" with hits. And unlike FIP and ERA, these two measures go the opposite directions (higher is better) and have a large variation (0.x to 100+) to allow for granularity in comparisons vs. compressing performance from 0 to 10 or so.
Fast-forward to 2010: Matt Swartz and Eric Seidman in a series of 4 articles at Baseball Prospectus (
part 1,
part 2,
part 3 and
part 4) introduced the metric of Skill-Interactive Earned Run Average or SIERA. Automatically, I realized that these guys had something (because a lot of their argument of creating this measure were similar to my objections with FIP and xFIP) and the more and more I dug, the more and more I like it. It basically looks at individual ways of pitching skills like inducing ground balls vs fly balls, striking out people, not walking people etc. Which is great. I think that is has become my favorite ERA-like measure (it too is on a ERA scale and lower is better) to look, but it is also a pain to derive (one needs Excel, on the other hand it is available in places like Fangraphs), but good luck try to figure splits like ground balls allowed as a starter vs as a reliever... The formula for posterity's sake is: SIERA = 6.145 – 16.986*(SO/PA) + 11.434*(BB/PA) – 1.858*((GB-FB-PU)/PA) + 7.653*((SO/PA)^2) +/– 6.664*(((GB-FB-PU)/PA)^2) + 10.130*(SO/PA)*((GB-FB-PU)/PA) – 5.195*(BB/PA)*((GB-FB-PU)/PA)
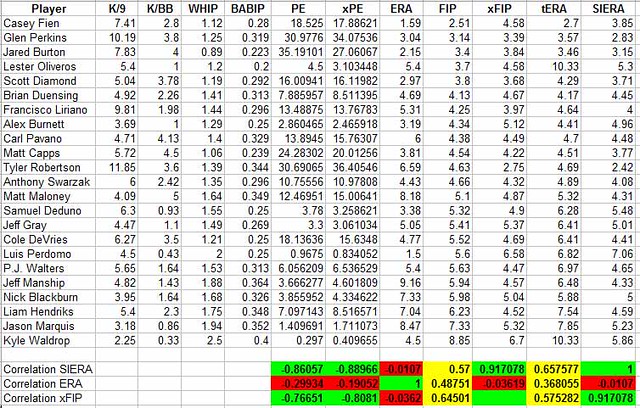
So, if it does not fit on a T-shirt (and it doesn't), I still need a quick way of looking at things. In the following table I took aggregate (i.e. Duensing's numbers are both for starting and relieving) Twins pitching numbers from 2012 from Fangraphs, including ERA, FIP, xFIP, SIERA and tRA (another measure I am not going to get into right now), calculated PE and xPE and looked at how all correlate with SIERA, xFIP and ERA:

As I mentioned PE and xPE go on a different direction (bigger number is better) than the others (ERA, FIP, xFIP, tRA and SIERA) so -1 is the best possible correlation factor for those (that would be a perfect match)
Happy to say that xPE, xFIP and SIERA correlate really nicely with themselves than with FIP and tRA and they all do not correlate with ERA, which is a good thing. Actually, I can get more into the nitty gritty dirt and say that xPE seems to correlate better with SIERRA in good to average performances and less in the bad performances, but still a .89 vs .91 correlation factor difference with this sample size is not significant.
(one of these off-seasons I promise I will play with bigger data samples, but I am keeping this about the Twins and their 2012 pitching....)
So how about them Twins?
I am looking at splits, so I am using xPE. And I am looking at starters vs. relievers vs. the league averages trying to compare the Twins rotation and pen to those and see if I can make any sense doing this. When I started this 3 and 4 years ago, PE and xPE average for AL starters was around 10 and for AL relievers around 11.5. And here are some ranges and classifications
Rotation:
xPE
35+ Ace
25-35 #1- #2 Starter
15-25 #2- #3 Starter
10-15 #3 - #4 Starter
7.5-10 #5 Starter
Bullpen:
xPE
35+ Closer
25-35 Closer-Setup
15-25 Setup- Long Relief
8-15 Long Relief-Mopup
The dual classifications indicate positions in Championship-caliber teams vs average teams. So in other words, in a championship team you better have 3 start pitchers with xPE above 15 and 2 with and xPE above 25 and a forth with xPE above 10.
Here is the data for the Twins rotation and pen (and for pitchers like Swarzak and Duensing I used their individual splits in each to calculate respective xPEs). Huge surprise (should not be huge but...) : By looking at the AL Averages, either pitching has improved, especially in the pen (where average xPE is 16; vs 12.5 in the rotation) or hitters do not hit the ball as well. A 2.5 point jump in averages for starters and 5 point jump for relievers is huge. And that would be an interesting thing to look during the off-season and might actually make me to adjust the classifications above upwards a bit.
Here are the numbers for the Twins rotation:

and here for the bullpen:

So as far as the rotation goes:
- The Twins have had 4 number 3 type starters (and not all the time - a lot of Diamond's and De Vries' starts were given to Marquis, Walters and Blackburn) Pavano has been injured and Liriano has ranged from a number one to below replacement.
- Going forwards the Twins can build on the fact that they have a couple of pitchers who can be number 3 starters in a good team (Diamond and De Vries) and someone who can be a number 5 starter (Hendriks) and seek a couple #1 and #2 starters to make a competitive rotation.
- Brian Duensing and Anthony Swarzak are better in the pen
- Something needs to be done with Nick Blackburn
As far as the pen goes:
- The Twins have a core of 3 very good relievers (Robertson, Perkins, Burton)
- Casey Fien has been a pleasant surprise
- Adding Duensing and Swarzak completes a nice pen that would need an additional arm (could be a free agent or some September call up to step up) It could be Capps, but his performance is not proportional to the $6.5 million option
- Alex Burnett, Jeff Gray, Jeff Manship, have not been effective (the jury is still out on Perdomo, Oliveros, Maloney and Waldrop because of the small sample )


