Showing posts with label Pitching Effectiveness. Show all posts

3/11/16

In depth analysis of Ricky Nolasco's performance, his stuff, root causes and a view in the future

Ricky Nolasco's performance with the Minnesota Twins has been a disappointment.  He was signed into a large 4-year contract after the 2013 season to be the Twins' Ace, a destiny he has yet to fulfill.   There has been discussion this Spring that despite that contract, Nolasco would have to earn a position in the 2016 Twins' rotation, and hints that at this point, he might be outside, looking in.   A couple of days ago, there were indications that he might not want to accept this, and the Twins' blogosphere and fan forums erupted.  I am not going to discuss this particular event at this point, other than say that it is not anything new.  For example, last season Mike Pelfrey did not take his demotion to the pen lightly, and back in the day, current Twins' closer Glen Perkins filed a Union grievance against the Twins for being demoted.  Nolasco's situation is not a done deal. Yet.   I think that it is really important to look at his performance, potential root causes for the drop and whether there is hope for Nolasco being an effective starter for the Twins.  I will attempt to do this by examining several metrics, and look at raw numbers and data about his pitches. 

A few years ago (2011) there was an excellent article about Nolasco, by Vince Caramela at The Hardball Times, titled Ricky Nolasco and the Disappearing Curveball.  He looked at Nolasco's pitch selection from 2008 to 2010 and concluded that Nolasco does not throw his curveball enough and has replaced it with a slider, which is not as good.   Let's take this as a starting point and look at Nolasco's pitch usage in his whole career from 2006-2015.

Very Important Note (and this stands for this whole article) :  2007 and 2015 data are based on 21.3 and 37.3 innings pitched only, so they might not be significant.  Here is Nolasco's % of each pitch:


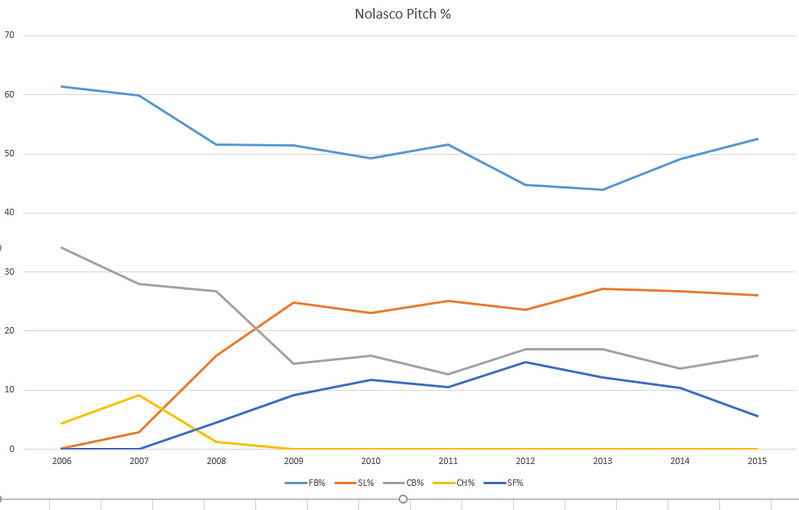
Clearly Nolasco decreased the use of his curve and started to replace some of its use with a slider beginning in 2008.  The year before, he replaced a change up with a split finger fastball.   How does this correlate with results?   Let's superimpose ERA+ and FIP+ on this graph to see any trends.  FIP+?  Is there such a beast.  I needed something analogous to ERA+ (higher is better), so I used FIP- (lower is better from Fangraphs) and took its mirror image around 100 (ie. 90 FIP- became 110 FIP+).   Here is the data:


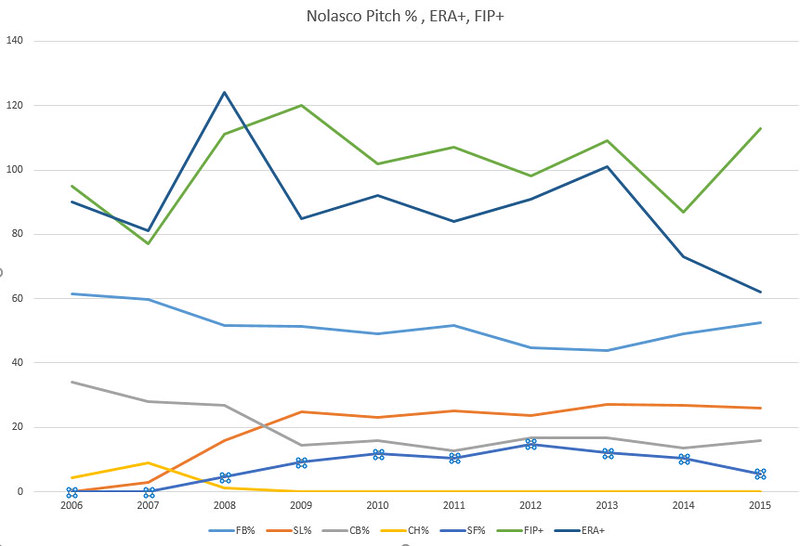
As you can see there is not much correlation of ERA+ (blue)  and FIP+ (green) with any individual pitch use and potential replacement of curveball with the slider. If anything, the  peaks in ERA+ and FIP+ are in 2008 and 2009, the years he started throwing that slider more and more.  Ok.  This theory does not seem very true.   How about contact?   Here is Contanct% off Nolasco in the years with ERA+ and FIP+


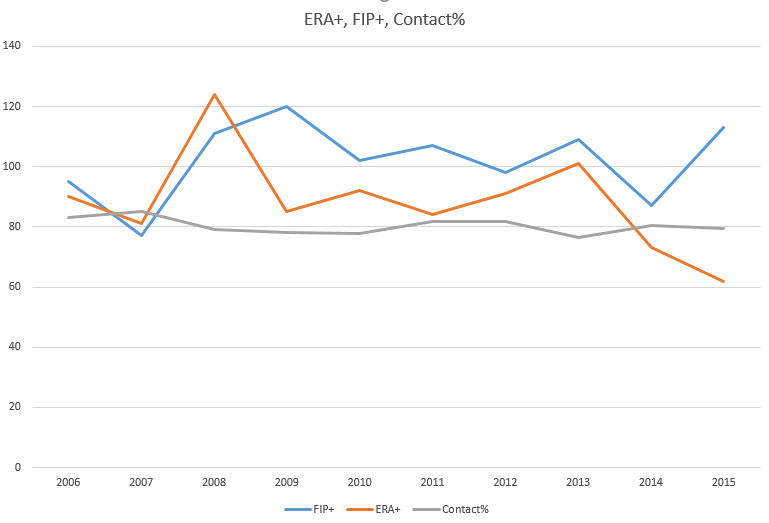
No.  Nothing there.  Contact% has been practically flat, and withing the standard deviation his whole career.  How about better contact or more contact or batting average in balls in play (BABIP?)  But this is luck.  Then how about percent of runners left on base, which also is luck.  %LOB fits this scale, but I had to normalize BABIP to something that looks like this (higher more favorable and around 100) so I created something I call BABIP+ : I took BABIP and multiplied by 300 (so it is around 100), but this would make higher less favorable, so this is more like BABIP-, so I did its mirror image around 100, and call it BABIP+.  Here we go:


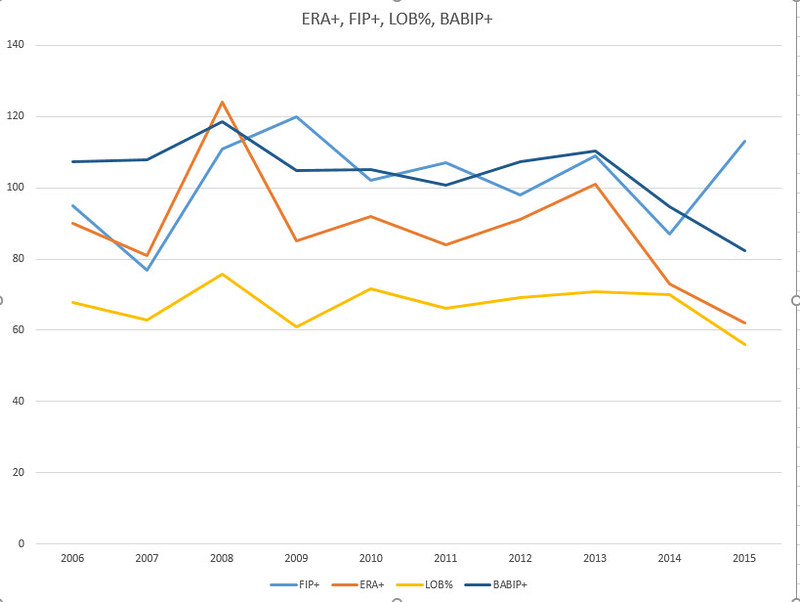
As you can see we are getting somewhere.  Both Left on Base and BABIP correlate nicely with ERA+ (orange), but not with FIP+ (lighter blue).  So why don't we call the beast by its name and make a single metric out of LOB% and BABIP to represent it and see how it correlates with ERA+


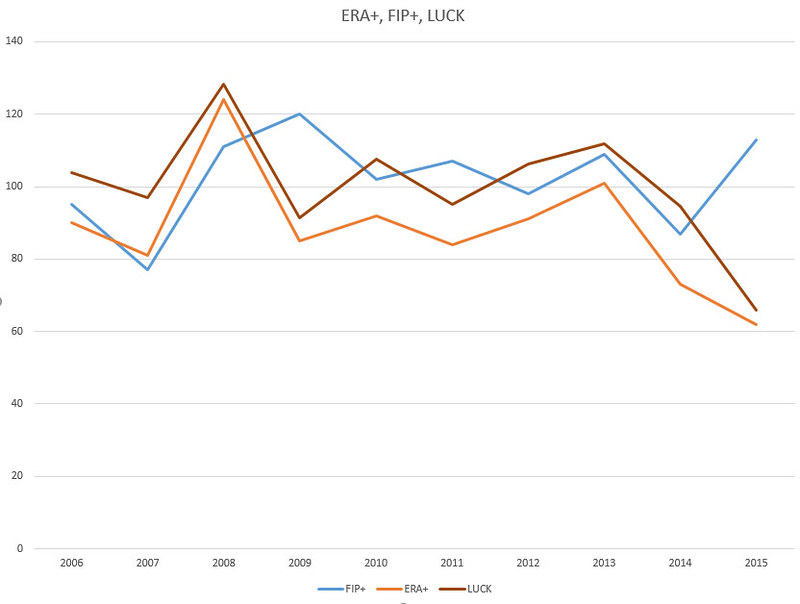
Here we have it.  Almost perfect correlation of ERA+ with LUCK. And LUCK is LOB% times BABIP+ and divided by 70 to fit in the scale.  So we confirmed what we always knew:  ERA and his derivatives, like ERA+,  have a lot of random causes, especially things outside of the control of the pitcher such as BABIP, LOB% etc (I could have used HR/FB here, too, but there is no point.) 

So the major reason for Nolasco's performance as measured by ERA+ (and ERA) was luck.  

How about FIP-based performance, which would actually more importantly tell us what the Twins may expect.  Is there anything that correlates well with FIP.  Clearly, there is a decline in FIP+ after 2009, with a few peaks, but the moving average is there.  There seem to be a couple of things. Enter mystery measurement:


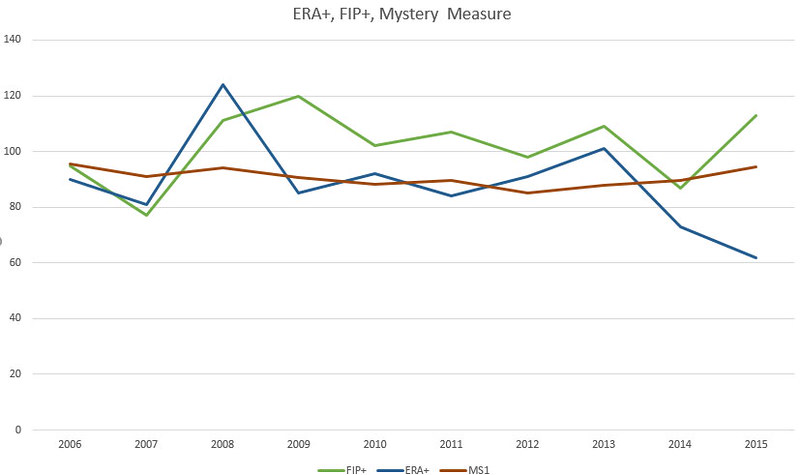
Ignore the ERA+ blue line here.  We are done with that.  This mystery measurement (burgundy) nicely approximates a FIP+ tendency. You can clearly see the peaks in 2008, 2011, 2013 and 2015 and the valleys in 2010 and 2012, but it is much smoother than FIP+.  It more like a running average, which could be a very good leading indicator.  What is Mystery Measure?  Something very simple and has to do with Nolasco's pitch selection:  It is the number of his pitches that were not changeups (a pitch he is not throwing any more) or split fingers, a pitch he has been throwing about 10% of the time as his off-speed pitch.  If you look at Fangraphs pitch values, this pitch has been below average and ineffective the last 3 seasons. 

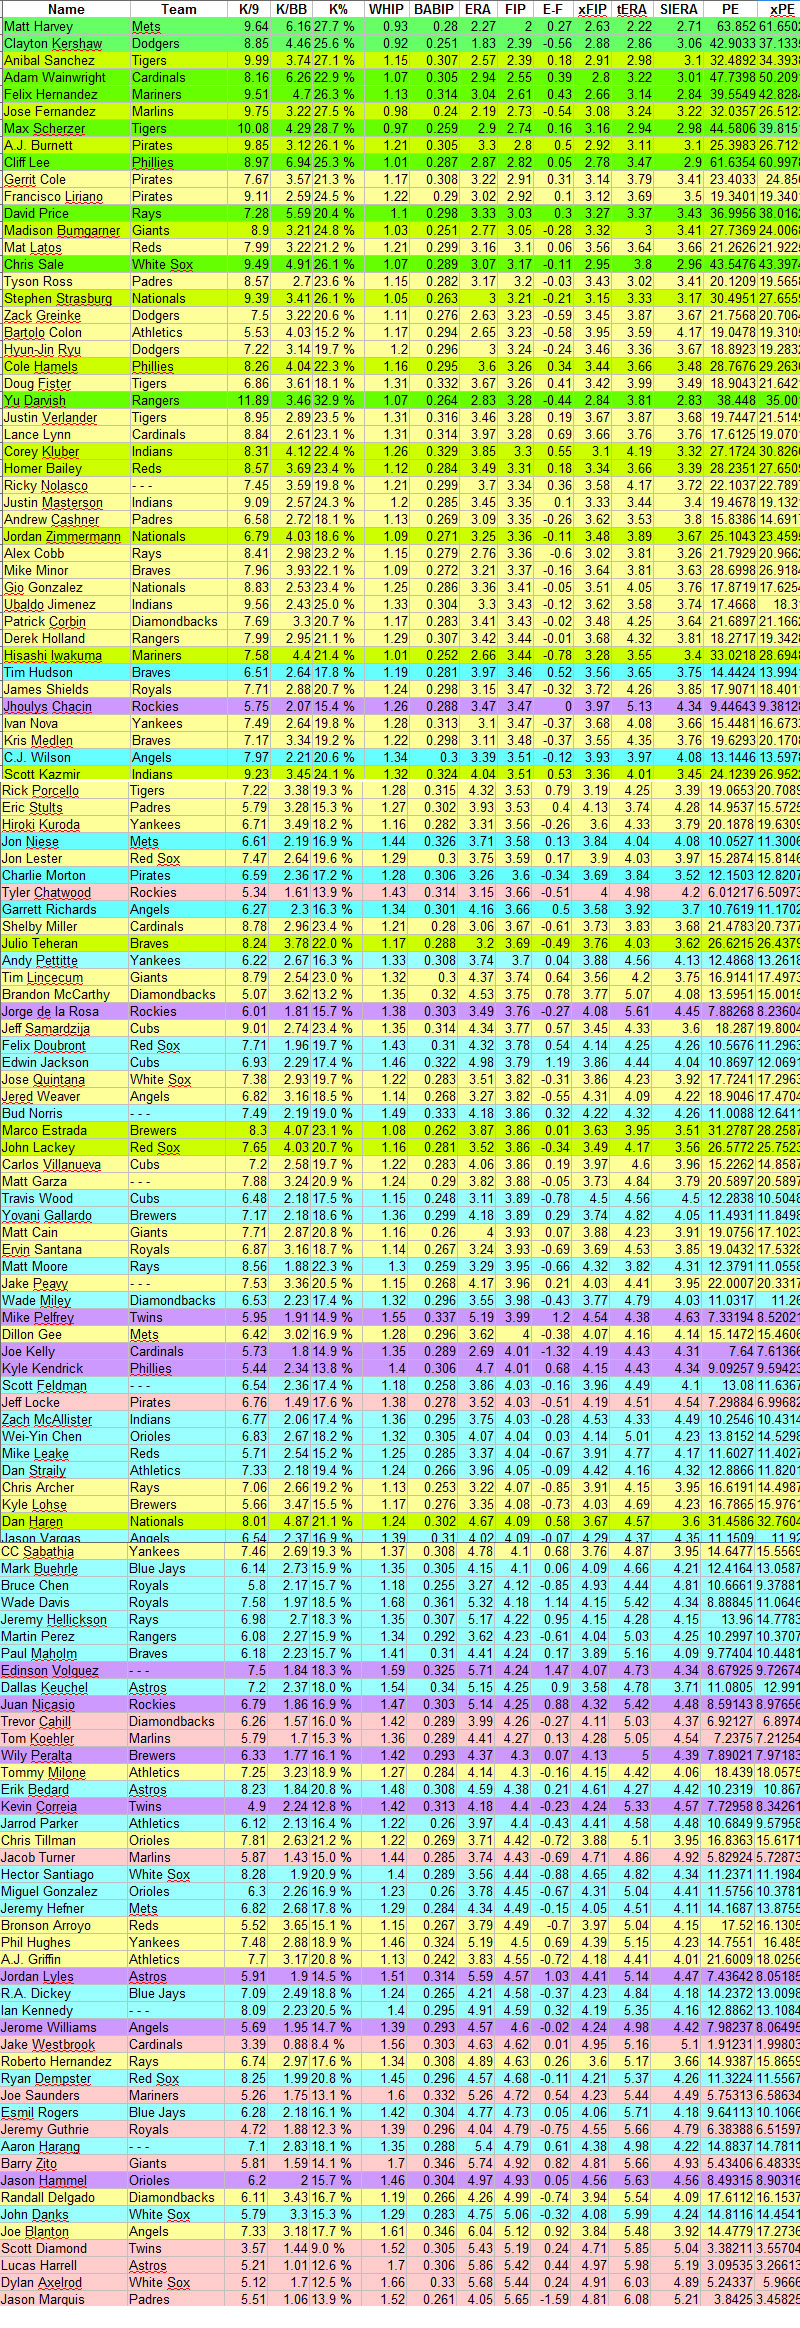
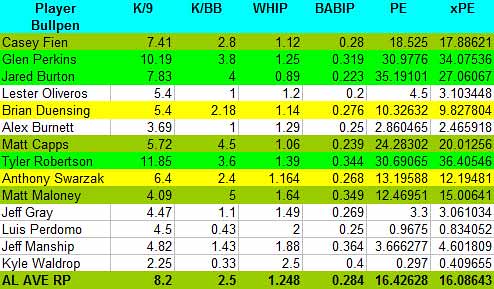
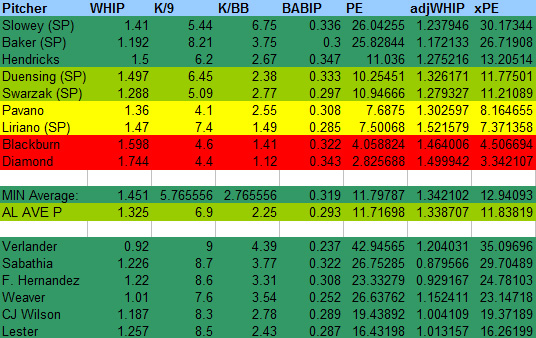
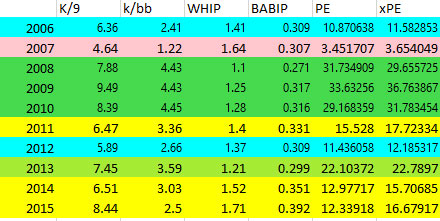
So one of the reasons that Nolasco has has bad years as measured by FIP+, is that his split finger fastball is not a good pitch for him.  Abandoning it and maybe replacing it with his curveball, will help him in the future.   But how much?  FIP is better than ERA, but FIP is not perfect either and the reasons are stated here.   My preferred tools in looking at pitcher performance are SIERA, which is also explained in the previous link, and it is a measure close to ERA and FIP scale and direction (lees is better) and PE and xPE, which I devised and are on a different scale and the opposite direction. Bigger is better.  They are quickly derived, unlike SIERA, and have a great correlation to SIERA, which makes them easy to use.  Here is Nolasco's career performance described by PE and xPE (xPE normalizes PE for league average BABIP, so it is more of a predictive tool than PE).  The xPE and PE scale is as follows for starters:

35+ Ace
25+ number 1 or 2
15+ number 2 or 3
10+ number 4 or 5
7.5+ number 5
<7 .5="" level="" p="" replacement="">

Clearly based on PE and xPE (and ERA+ and FIP+ before it, but not as obvious) Nolasco had a career peak from 2008-2010 when he was a top of the rotation starter, and declined afterwards.  There was an outlier hickup in 2013, which showed potential for a number 2 (or 3) starter and that was not realized?

So I am afraid that the 33 year old Nolasco is in the declining phase of his career reaching his peak at ages 26-28.  Here is some additional proof:  We are looking at his fastball and slider velocities through his career:


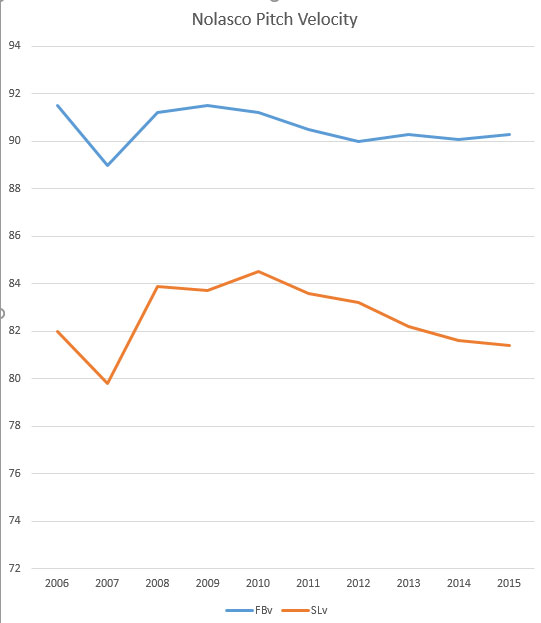
As you can see the velocities of the fastball, and especially the slider have been declining.  The slope of the decline in the Slider velocity is fascinating so I did this plot:


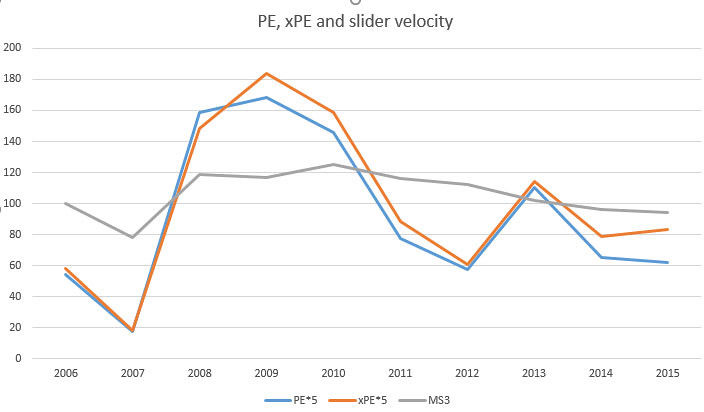
What you see is PE and xPE (both multiplied by 5 for scale) and normalized slider velocity when 2006 is 100.   PE and xPE really show clearly Nolasco's career bell curve, with the 2013 aberration, and unlike FIP, do not like his small sample 2016 either.   The normalized slider velocity clearly approximates the drop.  

So additional explanations for Nolasco's performance is that he is in his declining years and his slider is not what used to be.    For what is worth, Fangraphs pitch values, shows a considerable effectiveness of his slider in 2013, which definitely explains the bump in performance.

In summary:   Nolasco has been unlucky.  However, he is in the declining phase of his career, is a pitcher who lives and dies with his breaking stuff, because his fastball is an average pitch and his slit finger a bad pitch.  As his breaking stuff go, so does Nolasco.  He could be better in 2016 if:

a. Luck is on his side
b. His breaking stuff improves (if there were injury considerations) or no further declines
c. He stops throwing his split finger fastball and uses his curve as a change of pace pitch

You cannot determine A.  B will be a good leading indicator even in Spring Training and C. is totally up to him and his coaches and it is an easy fix.

11/18/13

Monday Graphic in Technicolor: 135 MLB starting pitchers classified based on 2013 performance, including the MNTwins targets.

Not many words because this picture (which you might have to wait until it loads) is worth and has more than 1000.  Here are the names and 2013 numbers of all 135 MLB starting pitchers who pitched more than 100 innings.  I thought that it would be a good reference as transaction will be taking place this off-season.  The measurements included are: K/9, K/BB, K%, WHIP, BABIP, ERA, FIP, E-F (ERA-FIP),  xFIP,  tERA, SIERA, PE, xPE.   If you are not familiar with PE and xPE, more on those here.    The pitchers are color coded based on the PE/xPE standards listed here with the key being:


Where "REPL" is replacement level.   Interesting to see that there are only nice pitchers with Ace performance (PE) or potential (xPE) based on the 2013 numbers and only fifteen number 1/2 starters (including a couple of free agents) based on the same criteria.  From the 3 Twins' starters that pitched more than 110 innings, two were in the 4 to 5 starter range (Pelfrey, Correia) and one (Diamond) in the Replacement range.  The list is shorted by increasing FIP.

Without further ado:


1/26/13

Assessing the Starting Pitching in the Twins' Organization

For a baseball team to content, one of three things need to happen:
  1. An organization has to develop impact starting pitchers.
  2. An organization has to trade for impact starting pitcher.
  3. An organizations has to sign impact starting pitcher free agents.
I demonstrated earlier this month that the Twins' last two year abysmal record could have been predicted as earlier as 2008, based on the state of their starting pitching prospects.  Only 11 pitchers who have been in the Twins' minors in 2008 are still in the organization and none has been an impact starter.  The Twins have been adverse in doing numbers 2 and 3 above, so in order to compete, they have to develop starting pitching talent.

The Denard Span and Ben Revere trades infused the Twins with 3 young starting pitchers: Vince Worley, 24, and Trevor May and Alex Meyer, both 22, which makes the future a bit more hopeful.  How hopeful?  I will try to quantify, so the rest of the discussion here will be metrics and numbers based.  This will actually be somewhat of a logical continuation of this analysis, where in August last year, I tried to look positively into the 2012 Minnesota Twins pitching and draw conclusions based on potential.  What I am doing here is looking at the whole organization Starting Pitching, under very similar metrics and see what the future might look like.  This will include potential rankings of Twins' starters, but it is not a prospect list.  They are based on their 2012 performance (and adjusted for age and playing level) and not their potential.  Injured players, such as Wimmers and Salcedo will be higher on prospect lists that ranked here, because their numbers were awful.

The metrics I like to use to do this have been some simple things of my own device: Pitching Effectiveness or PE and Expected Pitching Effectiveness or xPE.  I fiddled around with PE in 2008 and with xPE in 2009.  Here is the reason I devised PE and here is the reason I optimized it to xPE.  My main arguments were a. I felt like xFIP and FIP and DICE weigh too much things like home runs (which anyone who watched the home runs by Miquel Cabrera and Delmon Young against the Twins yesterday cannot deny that they are a matter of inches and ballpark and luck and fielding performance from being a long fly ball).  Also these formulae are hard to memorize and I wanted something simple I can calculate looking at a stat sheet and also something that you can calculate using splits (e.g. how has Brian Duensing or Glen Perkins been as a starter vs as a reliever); you can find xFIP around, but not in a spit form.  So in 2008 I devised PE, which simple takes account three things:  Strikeouts, walks and hits.  So a pitcher who strikes out more people, walks fewer and gives lesser hits is more likely to succeed than someone who doesn't.  And all hits are counted equal because the difference between a single and a triple might be the difference of having Delmon Young or Ben Revere play Left Field or the difference between a fly ball out and a home run might be the difference of having Torii Hunter or Rich Becker playing Center Field.  And I use WHIP, K/9 and K/BB to calculate PE (a simple PE= (K/9*K/BB)/WHIP).  xPE further normalizes for BABIP (to league average .290) to account for "luck" with hits.  And unlike FIP and ERA, these two measures go the opposite directions (higher is better) and have a large variation (0.x to 100+) to allow for granularity in comparisons vs. compressing performance from 0 to 10 or so.  Over here, I show that xFIP and FIP correlate pretty well to the much more complex SIERA, which is way too complex to be able to calculate just with a cell phone calculate (which is my goal as far as metrics go.)

PE and xPE have been fine to show performance and expected performance.  How about potential?  This is the many million dollar question, because if someone is able to guess estimate future potential of a player in single A, he/she will be having a great advantage in identifying cheap, future impact players, in a more objective way than scouting reports.  So yet a new measure in the PE family has been devised:  the adjusted expected pitching effectiveness or axPE.  I tried something similar the off-season after the 2008 season, but the resulting formula was too complicated (cannot fit on a T-shirt or be calculated using a cell phone calculator), so needed to be refined.  I hope I am close to this, since axPE is simpler.  It takes into consideration level of play.  Each level of play gets a number.  Here are these numbers:

All Rookie Leagues: 1
A: 2
A+: 3
AA: 4
AAA: 5
MLB: 6

the average of the levels a player participated is taken into consideration for axPE.  For example if a pitcher spent part of the season in high A and then moved to AA, the average level grade is 3.5.

The other adjustment involves someone's age.  Younger players in higher levels have higher potential; this is the premise here. axPE is defined as xPE* (level/age) *7 .  The 7 is a coefficient that makes it a number  in the neighborhood of PE and xPE.

A note of importance:  agPE is biased towards better performance in higher levels; this is by design, since there have been pitchers who blew away rookie leagues and then bottomed out when they went to AA.

The PE family metrics translators for starters (and relievers, for the sake of completeness, but RP are out of score here) are roughly translated to:

Rotation:
xPE/axPE
35+ Ace
25-35 #1- #2 Starter
15-25 #2- #3 Starter
10-15 #3 - #4 Starter
7.5-10 #5 Starter

Bullpen:
xPE/axPE
35+ Closer
25-35 Closer-Setup
15-25 Setup- Long Relief
8-15 Long Relief-Mopup

where axPE denotes intermediate/long term potential.

So, do the Twins have any potentially impact starters in their organization, based on their 2012 performance?

Without further ado, here are the numbers, that include pretty much every pitcher in the Twins organization, including the new ones, and those who pitched only in the major league level in 2012, under 30 years old.  The age indicated is their age in 2012.  I am including Nick Blackburn, for comparison's sake.  Raw data is taken from B-R and an (*) denotes LHP:


Thus,  it looks like the Twins have 3 potential impact starters in their organization; Kyle Gibson and Alex Meyer are not a surprise.  Cole DeVries is.  Cole DeVries' axPE is higher than his xPE level (which turns out to suggest a middle of the rotation starter), because he performed at the MLB level.  Whether or not potential is applicable to a 28 year old who has reached the majors, is a good discussion.   On the other extreme, some of the K/9 leaders in the organization, Josue Montanez, Taylor Rogers, Felix Jorge, Tyler Jones have repressed axPE, because they are still at the lower levels of the organization.  I think that they need to prove themselves at higher level.

Based on this, and if you cut the list at 25 years old or younger, the Twins have at least couple of pitchers who have impact starter (i.e. top of the rotation/ace) potential and several who have mid-rotation potential. 

A huge qualifier:  This list is of pitchers who were used mostly as starters (i.e. made more starts than relief appearances in 2012.)  This leaves at least one particular pitcher out who should be included, but he made 4 starts and 7 relief appearances:  Jose Berrios.  His numbers (albeit in 11 games and 30 some innings) are out of this world: 284.12 PE, 236.11 xPE, and 91.82 axPE.  He should be part of the discussion and definitely has top of the rotation potential, but there is an asterisk for the reasons mentioned.

Others who made few starts but mostly used in a relief role but definitely should be part of the equation are (in no order) : Matt Houser, Miguel Munoz, AJ Achter, Cole Johnson, Argentis Silva (the 16 year old high bonus singing) Elias Villasarra, Fernando Romero, Luke Bard, Jose Jimenez, Corey Kimes, Brett Lee and Mason Melotakis.

Again, this is an intermediate term discussion and does not really involve recent Twins veteran acquisitions Rich Harden, Mike Pelfrey and Kevin Correia.


8/16/12

xPE, xFIP, SIERA, the 2012 Twins pitching and other stories

For a while I wanted to take a bit of a formalized look at the Twins' pitching this season to see what we have learned and see what would make sense for the team to do in the future.  Also, it has been a while since I took a formalized look at Twins pitching, so it was about time.

The metrics I like to use to do this have been some simple things of my own device: Pitching Effectiveness or PE and Expected Pitching Effectiveness or xPE.  I fiddled around with PE in 2008 and with xPE in 2009.  Here is the reason I devised PE and here is the reason I optimized it to xPE.  My main arguments were a. I felt like xFIP and FIP and DICE weigh too much things like home runs (which anyone who watched the home runs by Miquel Cabrera and Delmon Young against the Twins yesterday cannot deny that they are a matter of inches and ballpark and luck and fielding performance from being a long fly ball).  Also these formulae are hard to memorize and I wanted something simple I can calculate looking at a stat sheet and also something that you can calculate using splits (e.g. how has Brian Duensing or Glen Perkins been as a starter vs as a reliever); you can find xFIP around, but not in a spit form.  So in 2008 I devised PE, which simple takes account three things:  Strikeouts, walks and hits.  So a pitcher who strikes out more people, walks fewer and gives lesser hits is more likely to succeed than someone who doesn't.  And all hits are counted equal because the difference between a single and a triple might be the difference of having Delmon Young or Ben Revere play Left Field or the difference between a fly ball out and a home run might be the difference of having Torii Hunter or Rich Becker playing Center Field.  And I use WHIP, K/9 and K/BB to calculate PE (a simple PE= (K/9*K/BB)/WHIP).  xPE further normalizes for BABIP (to league average .290) to account for "luck" with hits.  And unlike FIP and ERA, these two measures go the opposite directions (higher is better) and have a large variation (0.x to 100+) to allow for granularity in comparisons vs. compressing performance from 0 to 10 or so.

Fast-forward to 2010: Matt Swartz and Eric Seidman in a series of 4 articles at Baseball Prospectus (part 1, part 2, part 3 and part 4) introduced the metric of Skill-Interactive Earned Run Average or SIERA.  Automatically, I realized that these guys had something (because a lot of their argument of creating this measure were similar to my objections with FIP and xFIP) and the more and more I dug, the more and more I like it.  It basically looks at individual ways of pitching skills like inducing ground balls vs fly balls, striking out people, not walking people etc. Which is great. I think that is has become my favorite ERA-like measure (it too is on a ERA scale and lower is better) to look, but it is also a pain to derive (one needs Excel, on the other hand it is available in places like Fangraphs), but good luck try to figure splits like ground balls allowed as a starter vs as a reliever...  The formula for posterity's sake is:  SIERA = 6.145 – 16.986*(SO/PA) + 11.434*(BB/PA) – 1.858*((GB-FB-PU)/PA) + 7.653*((SO/PA)^2) +/– 6.664*(((GB-FB-PU)/PA)^2) + 10.130*(SO/PA)*((GB-FB-PU)/PA) – 5.195*(BB/PA)*((GB-FB-PU)/PA)

So, if it does not fit on a T-shirt (and it doesn't), I still need a quick way of looking at things.  In the following table I took aggregate (i.e. Duensing's numbers are both for starting and relieving) Twins pitching numbers from 2012 from Fangraphs, including ERA, FIP, xFIP, SIERA and tRA (another measure I am not going to get into right now), calculated PE and xPE and looked at how all correlate with SIERA, xFIP and ERA:


As I mentioned PE and xPE go on a different direction (bigger number is better) than the others (ERA, FIP, xFIP, tRA and SIERA) so -1 is the best possible correlation factor for those (that would be a perfect match)

Happy to say that xPE, xFIP and SIERA correlate really nicely with themselves than with FIP and tRA and they all do not correlate with ERA, which is a good thing.  Actually, I can get more into the nitty gritty dirt and say that xPE seems to correlate better with SIERRA in good to average performances and less in the bad performances, but still a .89 vs .91 correlation factor difference with this sample size is not significant.
(one of these off-seasons I promise I will play with bigger data samples, but I am keeping this about the Twins and their 2012 pitching....)

So how about them Twins?

I am looking at splits, so I am using xPE.  And I am looking at starters vs. relievers vs. the league averages trying to compare the Twins rotation and pen to those and see if I can make any sense doing this.  When I started this 3 and 4 years ago, PE and xPE average for AL starters was around 10 and for AL relievers around 11.5.   And here are some ranges and classifications

Rotation:
xPE
35+ Ace
25-35 #1- #2 Starter
15-25 #2- #3 Starter
10-15 #3 - #4 Starter
7.5-10 #5 Starter


Bullpen:

xPE
35+ Closer
25-35 Closer-Setup
15-25 Setup- Long Relief
8-15 Long Relief-Mopup


The dual classifications indicate positions in Championship-caliber teams vs average teams.  So in other words, in a championship team you better have 3 start pitchers with xPE above 15 and 2 with and xPE above 25 and a forth with xPE above 10.


Here is the data for the Twins rotation and pen (and for pitchers like Swarzak and Duensing I used their individual splits in each to calculate respective xPEs).  Huge surprise (should not be huge but...) :  By looking at the AL Averages, either pitching has improved, especially in the pen (where average xPE is 16; vs 12.5 in the rotation) or hitters do not hit the ball as well.  A 2.5 point jump in averages for starters and 5 point jump for relievers is huge.  And that would be an interesting thing to look during the off-season and might actually make me to adjust the classifications above upwards a bit.


Here are the numbers for the Twins rotation:


and here for the bullpen:


So as far as the rotation goes:

  • The Twins have had 4 number 3 type starters (and not all the time - a lot of Diamond's and De Vries' starts were given to Marquis, Walters and Blackburn) Pavano has been injured and Liriano has ranged from a number one to below replacement.
  • Going forwards the Twins can build on the fact that they have a couple of pitchers who can be number 3 starters in a good team (Diamond and De Vries) and someone who can be a number 5 starter (Hendriks) and seek a couple #1 and #2 starters to make a competitive rotation.
  • Brian Duensing and Anthony Swarzak are better in the pen
  • Something needs to be done with Nick Blackburn

As far as the pen goes:

  • The Twins have a core of 3 very good relievers (Robertson, Perkins, Burton)
  • Casey Fien has been a pleasant surprise
  • Adding Duensing and Swarzak completes a nice pen that would need an additional arm (could be a free agent or some September call up to step up)  It could be Capps, but his performance is not proportional to the $6.5 million option
  • Alex Burnett, Jeff Gray, Jeff Manship, have not been effective (the jury is still out on Perdomo, Oliveros, Maloney and Waldrop because of the small sample )


10/24/11

A contrarian opinion about the Twins' Starting Pitching

It is hard to look back at a 99-loss season and try to figure out what did not work, but it is necessary to just do that and try to pinpoint possible weaknesses that need to be solved. With a 99-loss season, pretty much nothing worked well, but prioritizing changes requires the identification of parts of the team that can be fixed relatively easily or by fixing them, it will make the biggest impact.

A lot of people in Twins territory, including fans and the press, and the Twins' management, as was referenced in the season ticket holder press conference a few weeks ago, see starting pitching as one of the weaknesses of the 2011 team, which needs to be fixed this off-season.

I examined that hypothesis, by looking at the performance of the Twins' starters in 2011 based on their on-field numbers. And the numbers disagree with that generalized belief.

3 years ago I devised a compound statistic measurement that indicates pitching effectiveness. Here I explain the idea behind the pitching effectiveness (or PE) measurement, and why I prefer it as an indicator of pitching performance independent of fielding or other external factors than other compound statistic measurements like FIP, xFIP and DICE. PE is (K/9*K/BB)/WHIP. A couple years ago, I devised another measurement expected PE or xPE, which is PE*(BABIP/.290), to further neutralize for "luck", reflecting what a pitcher's PE would be if his BABIP was .290 (League normal.)

Here is a list of the Twins' starters ranked by xPE for their 2011 performance. For pitchers who both started and relieved in 2011, only their numbers as starters are taken into consideration for the calculations. Also, the Twins' team average starter numbers are indicated as are the league average numbers. For comparison purposes, the numbers of AL starting pitchers who are considered as "Aces" and had the best starting pitching performances in 2011 are also included:


I included the following color coding: MLB average is green, above average darker green, below average yellow and well below average red.

A few observations (and I am sure that this is surprising to many out there) :


  • The Twins' starter as a group, had better performance that the league average

  • One pitcher's performance (Kevin Slowey) was bettered only by Verlander, while another one's (Baker's) trailed only Verlander and Sabathia and was better than Felix Hernandez, Weaver, CJ Wilson and Lester

  • Liam Hendricks, who will probably be in AAA in the start of 2012 season, had 4 very promising starts

  • Brian Duensing and Anthony Swardak were right there with the league average

  • Pavano's and Liriano's performance was below par. Liriano was injured the whole season (and exhibited a 2mph velocity drop. His 2010 numbers (20.38 PE, 23.68 xPE) are promising for a comeback, especially if his shoulder heals and velocity increases. Pavano is a decent end of the rotation innings eater, but at this point should not be considered anything more than a 5th pitcher in this staff (and his is compensated more than that; so there is a decision that needs to be made.)

  • Blackburn and Diamond do not belong in a major league rotation.


Ok. I know that this sounds pretty crazy and counter intuitive. It is contrary to what most Twins' fans, the press and the organizational brass believes. But the numbers do not lie; however the dismal results do not lie either? How do we reconcile these opposing facts? In other words, what happened if the Twins' starters pitched well?

Here are a few things that happened:

  • The Twins' as a team had a ridiculous high BABIP (opponents' Batting Average in Balls In Play). 0.318 as a team. As a matter of fact, other than Liriano, every starter had an elevated BABIP, and Slowey's, Duensing's, Blackburn's, and Hendicks' approached ridiculous levels

  • The Twins' defence, especially infield defense was one of the MLB worse. Here are the UZR/150 for each position as a total and for individual players at that position:


    • 1B: 11.4 (Mauer 27.8 UZR150/141 inn, Morneau 11.3/479, Hughes 11.0/274, Parmelee 8.1/173, Cuddyer 6.4/352)

    • 2B: -6.0 (Tolbert 5.1/244, Hughes 4.9/301, Casilla 2.2/470, Dinkelman -2.9/89, Cuddyer -20.8/140, Nishioka -39.7/49, Plouffe -41.8/127)

    • 3B: -7.1 (Valencia -6.2/1280, Hughes -9/104, Tolbert -42.3/37)

    • SS: -13.6 (Tolbert -3.2/210, Casilla -4.4/306, Nishioka -14.2/508, Plouffe -25/396)

    • LF: 2.5 (Plouffe 35.8/19, Repko 13.3/128, Benson 9.1/88, Young 5.4/642, Revere -3.1/112, Tosoni -3.8/321, Kubel -4.2/70, Dinkelman -18.2/40)

    • CF: 14.2 (Span 17.6/585, Revere 15.1/776, Benson 9.5/17, Repko -61.6/43)

    • RF: -1.8 (Revere 63.6/37, Repko 21.7/157, Dinkelman 6.3/22, Cuddyer 0.1/639, Benson -5.9/59, Mauer -8.3/9, Kubel -8.3/413, Plouffe -51.4/72, Tosoni -55.1/11)


    This deserves a whole post by itself, but I am just presenting the numbers at this point

  • The best pitchers did not pitch the most, because of injuries and because of bad choices by the manager and the coaches.

  • The bullpen was atrocious (and that's another story by itself), allowing a lot of inherited runs to score (inflating starters' ERAs) and losing leads


So how the Twins' starting pitching should look at 2012? What changes can be made and give better results?

  • Get everyone healthy. First and foremost. With a healthy, and presumed back to at least his 2010 form, Liriano, this team has 3 true strong pitchers.

  • Give the ball to your best pitchers. There is no way any other team would have alienated their best starter as this team has alienated Slowey. It is silly to have your best starter in the pen and give the ball to Blackburn (who does not belong in a major league rotation) because you gave him an ill-advised contract extension

  • Realize the fact that Pavano is a back of the rotation pitcher and do not treat him like an Ace. Either have him at number 4 or 5 or trade him to relief the team from that contract

  • Fix the defense. This is a no-brainer (and will get it's own post one of these days.) Also find some ways to score runs. This is another no-brainer and will get it's own post

  • The writing on the wall is that Hendricks will be heading to Rochester and Duensing to the bullpen. Hendricks can use some AAA time and I think that with Cole DeVries, who has been transitioning to a starter in AFL and has been pretty effective in 4 starts there, will form a good reserve corps at the AAA level. Duensing, despite what a lot of people think, has been a reliable league average starter. He can be a stellar reliever and could really help fix the bullpen.

  • Deal with Blackburn and Diamond. Blackburn (much like Perkins) has not been an effective starter in his Twins' tenure (ill-advised contract extension or not.) Putting him in the pen and hoping for same results as with Perkins is the best course of action. Diamond is not ready and needs to be in AAA and should not be the first option, if a starter is needed


So with these changes we are looking for a 2012 Twins' rotation of Slowey, Baker, Liriano, Swarzak and Pavano (or Duensing/Hendricks, if Pavano is traded.) I believe (and the numbers suggest) that this group can be successful in 2012 with better health, better management, better fielding and better defense. Despite what most people feel, the Twins' starting rotation was one of the (few) team's strengths in 2011.

What do you think?

11/12/08

Stop the presses: I made a prospect list (or 2)

Top prospect lists are more of a form of art than a science, since they use observational rather than numerical data as an input. There are several prospect lists out there, so is there a need for another?

I have been trying to devise a way to evaluate prospects objectively, without gut feeling rankings that once made Tod Van Poppel the best prospect in baseball. Also, I strongly believe that starting pitching, relief pitching and position playing are different beasts, so lists that contain all 3 of them are mixing apples and oranges and tangerines. So, let's talk about oranges and tangerines and leave the apples for another day.

I created a preliminary formula mid-season, taking a cut in rating the Twins prospects after 2007. I knew that it was rough and extremely preliminary. Since, I devised the PE measurement, components of which were in the pitching evaluating formula and I think that this one is a bit more accurate, so I am willing to share with a bit more confidence.

The formula I use to evaluate Minor league pitching prospects is containing the following criteria

  1. Overall effectiveness compared to the average MLB starter or reliever

  2. Effectiveness improvement each of the last 2 years compared to the previous year

  3. level of play (i.e. AAA, AA, A etc)

  4. number of levels ascended

  5. Age


The formula is:


Where PE is pitching efficiency this year, the MLB average PE is the average starter or reliever PE in the majors in 2008, depending on whether the prospect is a reliever (def: more games in relief than started) or a starter, the level is the highest level the player played that year described by as follows: Rk (DSL/GCL) 1, Rk (APP) 1.5, A 2, A+ 2.5, AA 3, AAA 4, MLB 5, and the levels ascended is the difference of the highest level played from the lowest level played the last 3 years (using the former numbers) + 1 (i.e. if a player started at A+ and assented to AAA, the levels ascended would be 4-2.5 = 1.5 + 1 = 2.5). The + 1 is there to avoid dividing by zero issues. Players that stay at the same level have level ascended = 1. Age is the age of the player in the beginning of a season. The effectiveness has a higher weight than improvement and improvement between this season and the last has a higher weight than improvement between last season and the season before. In order to keep the integrity of the results, players who showed a negative improvement were scored as 0; however negative effectiveness compared to MLB PE was scored as was.

Here is how the Twins' starting pitchers rank using this formula:

Daniel Osterbrock, 21, Rk (ELZ), 28.01

Pedro Guerra, 18, Rk (DSL), 14.18
Miguel Munoz, 19, Rk (GCL) 10.23
Adrian Salcedo, 17, Rk (DSL), 10.00

Eliecer Cardenas, 20 (Rk, DSL) 9.91
Ramon Acosta, 21, Rk (DSL) 8.70
Bobby Lanigan, 21, A, 7.99
Michael McCardell, 23, A, 7.53
David Bromberg, 20, A. 5.39

Anthony Swarzak, 22, AAA, 2.34
Tyler Robertson, 20, A+, 2.25
Shooter Hunt, 21, A, 2.23
Errol Simonitsch, 25, AA, 2.17 (released)
Angelo Sanchez, 19, Rk (GCL), 1.93
Martire Garcia, 18, Rk (GCL), 1.87
Michael Tarsi, 21, A, 1.60
Jeffrey Manship, 23, AA, 1.54
Kevin Mulvey, 23,AAA, 1.53
Cole Devries, 23, A+, 1.16
Philip Humber 25, AAA, 1.14

Brian Duensing, 25, AAA, 0.67
Ryan Mullins, 24, AA, 0.49
Steven Hirschfeld, 22, A, 0.41
Alex Burnett, 20, A+, 0.31
Yohan Pino, 24, AA, 0.26
Jay Rainville, 22, AA, 0.18

Daniel Berlind, 20, A, -0.19
Deolis Guerra, 19, A+, -0.46
Oswaldo Sosa, 22, AA, -0.95
Brian Kirwan, 20, A+, -0.96


Before the newly drafted class had a chance to make a dent I indicated that in my opinion, Pedro Guerra was the best arm in the Twins minor leagues, and that the DSL Twins have some of the best pitching prospects.Using these results, that statement proved to be pretty accurate. However, Dan Osterbrock who was drafted on the seventh round this year from University of Cinncinaty, put incredible numbers in Elizabethton (7-2, 13 GS, 75 IP, 104 K, 8 BB, 3.00 ERA, 1.04 WHIP) easily earning him the title of the best Twins starting pitching prospect.


Dan Osterbrock is a 6'3", 186 lbs, lefty from Cincinnati, OH. He has an 87-91 mph fastball with plus location and a great changeup, which is his out pitch. He needs to develop and improve his breaking pitches. Think of a lefty version of Kevin Slowey with a better change up and not as good breaking stuff. He helped lead Elizabethton to the best record in the Appalachian League.

The DSL wealth needs to be taken more seriously and the players need to be included in the prospect list pool; this is a fact.

As far as relievers go, here is the ranking:

Robert Delaney, 23, AA, 13.65

Jose Gonzalez, 18, Rk (DSL) 12.02
Andrei Lobanov, 18 Rk (GCL) 10.52
Leonardo Parra, 21, Rk (DSL), 10.42
Anthony Slama, 24, A+, 9.72
Michael Allen, 21, A+ 9.15
Edison Alvarez, 19, Rk (DSL) 8.07
Jose Mijares, 23, AA, 7.37

Curtis Leavitt, 21 Rk (Elz) 4.45
Joe Testa, 22, A+, 4.31
Bobby Korecky, 28, AAA 4.11
Matthew Williams, 21, A+. 4.09
David Martin, 22, A, 3.67
Steven Blevins, 21, A+, 3.14
Blair Erickson, 23, A+, 2.92
David Shinskie, 24, AA 2.85
Danny Rondon, 21, Rk (Elz) 2.69
Ben Julianel, 28, AA, 2.49
Renzo Reverol, 17, Rk (DSL) 2.25

Jose Lugo, 24, A+, 1.74
Santos Arias 21, A, 1.73
Matthew Fox, 25, A+, 1.28
Bradley Tippett, 20, A, 1.27
Kelvin Mota, 20, Rk (GCL) 1.17
Timothy Lahey, 26, AAA, 1.08
Carlos Gutierrez, 21, A+, 1.04

Charles Nolte, 22, A, 0.98
Spencer Steedley, 23, A+ 0.84
Ludovicus Van Mil, 23, A, 0.69
Thomas Wright, 20, Rk (Elz), 0.64
Mariano Gomez, 25, AAA, 0.55
Ricky Barrett, 27, AAA, 0.36
Frank Mata, 24, AA, 0.23
Armando Gabino, 24, AA, 0.07
Henry Reyes, 23, A+, 0.04
Jean Mijares, 20, Rk (GCL) 0.01

Bruce Pugh, 19, Rk (GCL) -0.06
Jay Sawatski, 26, AA, -0.18
Carlos Carrillo, 18, Rk (DSL), -0.27
Kyle Aselton 25, AA, -0.31
Chris Anderson 22, A, -0.72
Eddy Santana, 20, Rk (DSL) -0.83
Lesmir Vargas, 21, Rk (DSL), -0.84
Lee Martin, 22, Rk (Elz) -0.98
Michael Mopas, 20, Rk (GCL) -1.12 (released)
Danny Hernandez, 22, A+, -1.15


The ranking of the relievers indicates the the winner of the MiLB pitcher of the year award, Robert Delaney, is the best Twins' reliever prospect, which is not a surprise.

Back to the formula. Do I think it's perfect? Nope. But I think that if a pitcher has actualized a 12.48 K/9, 13 K/BB, and 1.04 WHIP season (Osterbrock) should be valued more and ranked higher than a pitcher who supposedly has better tools but has been regressing every year in his professional career (Deolis Guerra). Think of it as a car race: If a driver with a stock Chevy Impala beats a driver with a stock Ferrari Testarossa more kudos to him. The Ferrari guy needs to know how to use his car and until he proves so, he should not be taken seriously. And this is not a list of who is the most ready for the majors, but of who has the most potential based on actualized potential and improvement throughout his minor league career, factoring in his age and level of play.

Because people would like to see tidy lists, here is my list of the top 15 starting pitching prospects and the top 20 relief prospects.

Starters

  1. Daniel Osterbrock

  2. Pedro Guerra

  3. Miguel Munoz

  4. Adrian Salcedo

  5. Eliecer Cardenas

  6. Ramon Acosta

  7. Bobby Lanigan

  8. Michael McCardell

  9. David Bromberg

  10. Anthony Swarzak

  11. Tyler Robertson

  12. Shooter Hunt

  13. Errol Simonitsch

  14. Angelo Sanchez

  15. Martire Garcia


Relievers

  1. Robert Delaney

  2. Jose Gonzalez

  3. Andrei Lobanov

  4. Leonardo Parra

  5. Anthony Slama

  6. Michael Allen

  7. Edison Alvarez

  8. Jose Mijares

  9. Curtis Leavitt

  10. Joe Testa

  11. Bobby Korecky

  12. Matthew Williams

  13. David Martin

  14. Steven Blevins

  15. Blair Erickson

  16. David Shinskie

  17. Danny Rondon

  18. Ben Julianel

  19. Renzo Reverol

  20. Jose Lugo


Now that I am done with the oranges and tangerines, next will take a look at the apples, but, alas, there are a lot of varieties of them, so they will need to be sorted out.

Something about pitching or why Kevin Slowey was more effective than Johan Santana

In order to evaluate position players more effectively, a couple of weeks ago I introduced a new statistic, bating and fielding efficiency (BFE). There are some established statistical measure that can tell you about a pitcher's performance, independent of the fielding of the team behind him. A couple of those are Fielding Independent Pitching (FIP) and eXpected Fielding Independent Pitching (xFIP) and Defense-Independent Component ERA (DICE). You can see the formulae for these measurement in this excellent Wikipedia article. I have 2 problems with these formulae:

  1. They use arbitrary numericals to factor and add to the statistical measurements within their equations (3, 13, 2, 3.2)

  2. For some strange reason, hits given are not included, but home runs are, factored by a huge 13-times factor

  3. Bases on balls are factored by 3, strikeouts are factored by 2

  4. Home runs are based mostly on a hitters capability and the park and not on the pitcher, whereas the defense does not have that much of a role for a hit.


Let's clarify the last point:
One of the statistics I will use to evaluate pitching is WHIP. Arguably, WHIP might be defense dependent, but how much?

Defense has 2 flavors:

a. accuracy - reflected by Errors. Errors do not count on WHIP, so that is out.

b. range - let’s use the plus minus system for this to understand the impact:

in 2008 the best defender in baseball as far as plus-minus goes was Chace Utley with a total score of 49 (i.e. he made 49 plays the average player does not make). He made a total of 803 plays (340 POs and 463 assists) even if we assume that all those +49 plays took a hit away (which is a stretch, because some of those were to get the lead runner in a double play or fielder’s choice, both of which do not take hits away from a pitcher’s WHIP).

49 is 6.1% of his total plays. If you divide that by 5 starting pitchers you get 1.2%.

So the best defender in baseball saved 1.2% of the hits for a particular starting pitcher (stretch). If you take the MLB average for 2008 pitchers 0.37 BB/Hits, 0.37 of a pitcher’s WHIP is a factor of BB and 0.73 a factor of hits. So the difference that the best ranging defender can potentially make on a pitcher’s WHIP is 0.88%

With examples:

Perkins’ WHIP in 2008 was 1.470, in that theoretical best case scenario would have been 1.457

Let’s go more extreme: here are the best plus minus numbers per position in 2008 (2B was Utley): 1B +24, 3B + 32, SS +23, LF +23, CF +32, P +16.
If you build a team with those people as defenders, the 0.88% difference above due to just Utley would become 2.8%

In other words, Perkins with the best defense in the MLB Universe of 2008 would have a WHIP of 1.429 instead of 1.470 (even with the best case scenario that all plus plays take hits away). Not much difference. Certainly not enough to discount the hits a pitcher gives as part of how effectively he pitches.

I created a new measurement, called Pitching Effectiveness (PE) which is simply: (K/9*K/BB)/WHIP. All these factors take into account how a pitcher is performing without extraneous factors. Here is a list of the 2008 MLB pitchers who pitched more than 20 innings and had a PE over 20, broken down by starters and relievers and sorted by decreasing PE (I included all Twins pitchers for comparison):

Starters

Dan Haren, AZ 39.13
Josh Beckett, BOS 37.83
Roy Halladay, TOR 37.81
Ervin Santana, LAA 35.79
CC Sabathia, MIL 34.08
Ricky Nolasco, FLA 31.68
Cliff Lee, CLE 30.84
Rich Harden, CHC 30.77
Kevin Slowey, MIN 30.67
Tim Lincecum, SF 28.29
Randy Johnson, AZ 26.85
Mike Musina, NYY 26.66
Cole Hamels, PHI 26.52
James Shields, TBR 23.23
Johan Santana, NYM 22.54
Javier Vasquez, CHW 21.46
Roy Oswalt, HOU 21.19
Scott Baker, MIN 20.98
Ben Sheets, MIL 20.97
Zack Greike, KCR 20.86
Jake Peavy, SD 20.50

Other Twins:

Boof Bonser: 13.44
Fransisco Liriano: 11.91
(Matt Garza 10.91)
Nick Blackburn: 8.09
Glenn Perkins: 5.69
(Livan Hernandez: 3.13)

Relievers

Mariano Riviera, NYY 189.22
Jonathan Papelbon, BOS 101.06
Billy Wagner, NYM 57.94
Sergio Romo, SFG 51.05
Kerry Wood, CHC 49.00
Hong-Chih Kuo, LAD 48.76
Grand Balfour, TB 48.49
Trevor Hoffman, SD 45.02
Joe Nathan, MIN 44.89
Scott Eyre, PHI 43.89
Matt Thorton, CHW 41.92
Brian Fuentes, COL 39.87
Mike Adams, SD 38.14
Joey Devine, OAK 37.91
Tagashi Saito, LAD 36.16
Joakim Soria, KCR 35.56
Carlos Marmol, CHC 35.22
Frank Francisco, TEX 32.67
Octavio Dotel, CHW 32.43
Rafael Perez, CLE 32.16
Scott Linebrink CHW 32.00
Chad Qualls AZ, 31.91
Jonathan Broxton, LAD 31.87
Jose Valverde, HOU 31.71
Mike Gonzalez, ATL 31.14
Jon Raunch, AZ 28.83
Max Scherzer, AZ 27.06
Brad Lidge, PHI 25.61
Joba Chamberlain, NYY 25.50
Neal Cotts, CHC 25.10
Taylor Buchholz, COL 24.89
Wade Corey, LAD 23.65
Joe Nelson, FLA 23.01
JUan Cruz, AZ 22.52
Jeremy Affeldt, CIN 22.37
Damaso Marte, NYY 22.36
Ramon Troncoso, LAD 22.10
Edwar Ramirez, NYY 21.89
Jesse Carlson, TOR 20.91
Doug Brocail, HOU 20.90
Arthur Rhodes, FLA 20.45
Brandon Morrow, SEA 20.12
Manny Delcarmen, BOS 20.08

Other Twins:

(Pat Neshek: 31.64 less than 20 innings)
Dennys Reyes: 16.59
Craig Breslow: 13.59
Jesse Crain: 10.90
Matt Guerrier: 7.00
(Juan Rincon: 6.27)
(Brian Bass: 4.58)

The MLB averages for 2008 were:

MLB starter average WHIP 1.39
MLB starter average K/9 6.20
MLB starter average K/BB 2.06
MLB Starter average PE: 9.19


MLB reliever average WHIP 1.39
MLB reliever average K/9 7.80
MLB reliever average K/BB 1.94
MLB reliever average PE: 10.89


It is expected that relievers would have higher PE numbers than starters and they do. A couple of observations: Slowey and Baker were the best Twins starters. Slowey is among the pitching elite. BTW, for those who are lamenting the Delmon Young trade, Matt Garza's PE was 10.91, placing him as the 5th best potential Twins starter. Glenn Perkins is trailing the starting group and Nick Blackburn's numbers are below MLB average, making Perkins and potentially both expendable. Bonser should get another chance to make the rotation and Liriano's PE was hurt by his horrid first few starts.

The Twins need at least 2 relievers above 20 in 2009 now that they lost Neshek. Mijares could be there, but at least another right handed reliever would be welcomed. From the list of relievers here, Jeremy Affeldt (22.37), Doug Brocail (20.90), Juan Cruz (22.52), Brian Fuentes (39.89, probably a closer someplace other than the Twins), Trevor Hoffman (45.02, probably a closer someplace other than the Twins), Bobby Howry (23.40), Damaso Marte (22.36), Arthur Rhodes (20.45) and Kerry Wood (49.00, probably a closer someplace other than the Twins) are free agents; so are Kyle Farnsworth (16.55), Brandon Lyon (15.23), Will Ohman (15.74), Darren Oliver (15.62) and Russ Springer (17.26), all with PE higher than the remaining Twins. Given the facts that the Twins would probably like a right hander and some of the above players will sign as closers, the list gets smaller, but there are still more than a few potential targets remaining. Other than Guerrier, the remaining bullpen arms were above league average in 2008.

One last parting thought: The PE is a useful tool to identify future closers. I think that PE > 40 equals good closer material. From the above list:

Sergio Romo, SFG 51.05
Hong-Chih Kuo, LAD 48.76
Scott Eyre, PHI 43.89 and
Matt Thorton, CHW 41.92

show closer potential.