RHP: Julio DePaula (AAA), Danny Graves (AAA), Tom Shearn (AAA)
LHP: Ricky Barrett (AAA), Carmen Cali (AAA), Mariano Gomez (AAA), Jason Miller (AA)
1B: Garrett Jones (AAA)
2B: Felix Molina (AA)
SS: Sergio Santos (AAA)
OF: Joe Gaetti (AA), Darnell McDonald (AAA), Tommy Watkins (AAA)
I hope that Mariano Gomez gets re-signed. Other than that, it is about time that younger players with more potential play at Rochester.
11/7/08
11/6/08
Do stolen bases and GIDP matter for Gardy's Twins to win?
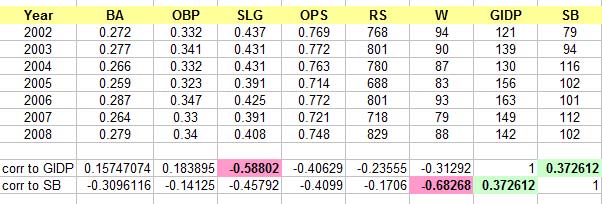
A couple of weeks ago I examined what makes the Gardenhire Twins win, looking for potential improvements in that caterogy. I was recently asked to examine the effect of SB and GIDP and its correlation with Twins wins. The following should be familiar. It basically lists all the statistical measurements examined in the previous post with the addition of SB and GIDP and their correlation to wins.

One surprise: Stolen bases have a negative correlation to wins for the Gardy Twins, which is actually stronger than the positive correlation of runs scored (compare the pink boxes). In plain english, this means that this team has less chance to win if they steal. By first glance this looks like a paradox, albeit an interesting one. OPS still has the higher correlation to wins and GIDP does have an expected negative correlation (albeit not extremely strong) with wins.
I dug further and examined the correlation of both GIDP and SB with the other offensive statistic measurements as well as with wins:

GIDP (top line in the bottom of the table) has the highest negative correlation with SLG and the highest positive correlation with SB. SB, has the highest positive correlation with GIDP and the highest negative correlation with wins.
In other words:
1. The higher the number of stolen bases the less wins the team has
2. The higher the number of stolen bases the more GIDP (and the reverse) the higher the number of GIDP, the higher the number of SB
3. The higher the number of GIDP the lower the SLG.
Statement 3 makes absolute empirical sense. Statement 2 is fine also: the more a team grounds into double plays, the more it wants to run to prevent DP so the more SB. Statement 1 is the kicker that defies empirical knowledge and bit of further discussion is necessary.
Regardless the perception that stolen bases increase the probability of a team to win, James Click of Baseball Prospectus has shown that this is not a case in an article called What if Ricky Henderson Had Pete Incavilia's Legs?, Published in the Baseball Prospectus' book Baseball Between the Numbers. The previous link is a link to the whole book (pointing at the pertinent chapter) available free at google books. Great read. A must for stat fans. So despite the popular empirical opinion, stolen bases have been proven to decrease win probability and the 2002-2008 Twins, confirm this fact.
As a conclusion, OPS is still the best correlating measurement to Wins for these Twins. And OPS (and projected OPS) could be used as a leading indicator to predict wins as I did here. This is fine for these Twins, but how about the rest of the league? What if you wanted to start a team from scratch or select a fantasy team? What would be the best league indication away from the context of the Gardy Twins?
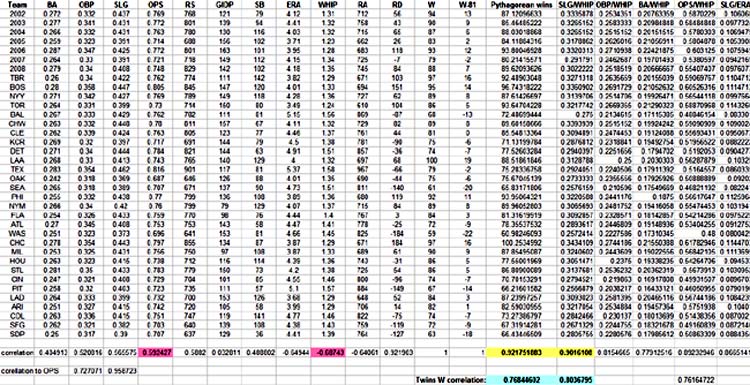
To answer this question I looked at the same statistic measurements I examined for the 2002-2008 Twins, with the addition of Pythagorian Wins a Bill James measurement that predicts wins based on runs scored and allowed. Pythagorian Wins is a lagging indicator, which it means that it confirms trends and events rather than predict them (in other words, a game has to be played before you get the RS and RA measurements, whereas you can use historical or predicted OPS values to predict future performance). The following chart will probably look like an eye-chart:

Here is the summary. Looking across the MLB teams in 2008. The best correlating measurement with Wins is Pythagorian Wins (0.922). The correlation of other categories were: BA:0.405, OBP:0.521, SLG:0.566, OPS: 0.592, RS: 0.588, GIDP: 0.033 (practically non correlated), SB: 0.489 (surprisingly a + correlation), ERA: -0.649 (the higher the ERA the fewer wins), WHIP: -0.687 and RA: -0.641. Unfortunately, not a single statistic that could be used as a leading indicator has similar correlation to wins as Pythagorian Wins (runs cannot be used as leading indicators). Plan B: create a composite measurement. I created 8 measurements dividing each of the 4 offensive categories (BA, OBP, SLG, OPS) with the 2 pitching categories (ERA, WHIP). Here is their correlation to Wins: SLG/WHIP: 0.907, OBP/WHIP: 0.815, BA/WHIP: 0.779, OPS/WHIP: 0.892, SLG/ERA: 0.867, OBP/ERA: 0.763, BA/ERA: 0.765 and OPS/ERA: 0.835.
As you can see SLG/WHIP has a correlation of 0.907, close to that of Pythagorian Wins 0.922) and could be used as a leading indicator for team wins. In other words, if you assemble a team from scratch, real life or fantasy look for batter with high SLG and pitchers with low WHIP.
But how about them Twins? Well, for the Gardy Twins, the correlation of wins with Pythagorian wins was 0.768 and the correlation of SLG/WHIP with wins was 0.804, both lower than the correlation of OPS with wins (0.886). So, in other words, if you want to make the Twins better, look for batters with high OPS, esp the SLG part of OPS, because that correlates with OPS for these Twins at a close to absolute 0.959 rate.
Why is that discrepancy between the Gardy Twins and the rest of the league? Here is my theory and deemed to be vastly unpopular but not surprising to the people who have been following this blog. Look at this table for the Gardy Twins:
The harder the division has gotten in the Gardy ERA (right column is the record of the rest of the division) the harder time the Twins have to achieve their predictive record. They fell short a win or two, but a win or two would have gotten the Twins in the postseason this year. Why does this happen? Methinks is the manager who does not realize the full potential of the team. But this is another long discussion.
Next: evaluating pitchers.

One surprise: Stolen bases have a negative correlation to wins for the Gardy Twins, which is actually stronger than the positive correlation of runs scored (compare the pink boxes). In plain english, this means that this team has less chance to win if they steal. By first glance this looks like a paradox, albeit an interesting one. OPS still has the higher correlation to wins and GIDP does have an expected negative correlation (albeit not extremely strong) with wins.
I dug further and examined the correlation of both GIDP and SB with the other offensive statistic measurements as well as with wins:

GIDP (top line in the bottom of the table) has the highest negative correlation with SLG and the highest positive correlation with SB. SB, has the highest positive correlation with GIDP and the highest negative correlation with wins.
In other words:
1. The higher the number of stolen bases the less wins the team has
2. The higher the number of stolen bases the more GIDP (and the reverse) the higher the number of GIDP, the higher the number of SB
3. The higher the number of GIDP the lower the SLG.
Statement 3 makes absolute empirical sense. Statement 2 is fine also: the more a team grounds into double plays, the more it wants to run to prevent DP so the more SB. Statement 1 is the kicker that defies empirical knowledge and bit of further discussion is necessary.
Regardless the perception that stolen bases increase the probability of a team to win, James Click of Baseball Prospectus has shown that this is not a case in an article called What if Ricky Henderson Had Pete Incavilia's Legs?, Published in the Baseball Prospectus' book Baseball Between the Numbers. The previous link is a link to the whole book (pointing at the pertinent chapter) available free at google books. Great read. A must for stat fans. So despite the popular empirical opinion, stolen bases have been proven to decrease win probability and the 2002-2008 Twins, confirm this fact.
As a conclusion, OPS is still the best correlating measurement to Wins for these Twins. And OPS (and projected OPS) could be used as a leading indicator to predict wins as I did here. This is fine for these Twins, but how about the rest of the league? What if you wanted to start a team from scratch or select a fantasy team? What would be the best league indication away from the context of the Gardy Twins?
To answer this question I looked at the same statistic measurements I examined for the 2002-2008 Twins, with the addition of Pythagorian Wins a Bill James measurement that predicts wins based on runs scored and allowed. Pythagorian Wins is a lagging indicator, which it means that it confirms trends and events rather than predict them (in other words, a game has to be played before you get the RS and RA measurements, whereas you can use historical or predicted OPS values to predict future performance). The following chart will probably look like an eye-chart:

Here is the summary. Looking across the MLB teams in 2008. The best correlating measurement with Wins is Pythagorian Wins (0.922). The correlation of other categories were: BA:0.405, OBP:0.521, SLG:0.566, OPS: 0.592, RS: 0.588, GIDP: 0.033 (practically non correlated), SB: 0.489 (surprisingly a + correlation), ERA: -0.649 (the higher the ERA the fewer wins), WHIP: -0.687 and RA: -0.641. Unfortunately, not a single statistic that could be used as a leading indicator has similar correlation to wins as Pythagorian Wins (runs cannot be used as leading indicators). Plan B: create a composite measurement. I created 8 measurements dividing each of the 4 offensive categories (BA, OBP, SLG, OPS) with the 2 pitching categories (ERA, WHIP). Here is their correlation to Wins: SLG/WHIP: 0.907, OBP/WHIP: 0.815, BA/WHIP: 0.779, OPS/WHIP: 0.892, SLG/ERA: 0.867, OBP/ERA: 0.763, BA/ERA: 0.765 and OPS/ERA: 0.835.
As you can see SLG/WHIP has a correlation of 0.907, close to that of Pythagorian Wins 0.922) and could be used as a leading indicator for team wins. In other words, if you assemble a team from scratch, real life or fantasy look for batter with high SLG and pitchers with low WHIP.
But how about them Twins? Well, for the Gardy Twins, the correlation of wins with Pythagorian wins was 0.768 and the correlation of SLG/WHIP with wins was 0.804, both lower than the correlation of OPS with wins (0.886). So, in other words, if you want to make the Twins better, look for batters with high OPS, esp the SLG part of OPS, because that correlates with OPS for these Twins at a close to absolute 0.959 rate.
Why is that discrepancy between the Gardy Twins and the rest of the league? Here is my theory and deemed to be vastly unpopular but not surprising to the people who have been following this blog. Look at this table for the Gardy Twins:
year         actual wins      pythagorian wins    AL Central Record- Twins

2002            94                  87                 .421
2003            90                  85                 .432
2004            87                  88                 .452
2005            83                  84                 .492
2006            93                  94                 .502
2007            79                  80                 .502
2008            88                  90                 .492
The harder the division has gotten in the Gardy ERA (right column is the record of the rest of the division) the harder time the Twins have to achieve their predictive record. They fell short a win or two, but a win or two would have gotten the Twins in the postseason this year. Why does this happen? Methinks is the manager who does not realize the full potential of the team. But this is another long discussion.
Next: evaluating pitchers.
Subscribe to:
Comments (Atom)


