Here is the Twins' starters and reliever's ERA month by month:

Here is the Twins' starters and reliever's WHIP month by month:
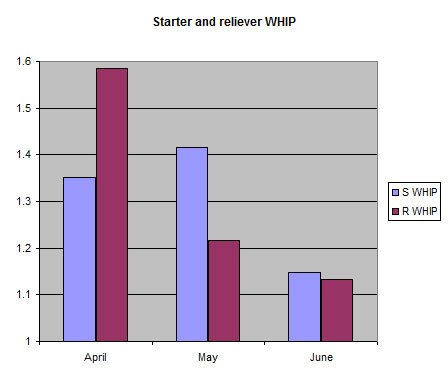
This looks a bit surprising. Yes the starters were pretty bad in April and May, but it looks, using traditional measurements, that the pen had turned the corner in May before becoming really good in June. Sub 3.50 ERA and WHIP around 1.250 is pretty good? Isn't it? That surely conflicts with the empirical observation that the pen was not that great in May. Who is to believe? Your eyes or the numbers? That bullpen surely surrendered leads in May.
As I explained last November there are just not many good measurements to describe and evaluate the state of pitching, and this is why I created the "Pitching Efficiency" measurement (PE= (K/9*K/BB)/WHIP).
Here is the Twins' starters and reliever's PE month by month:
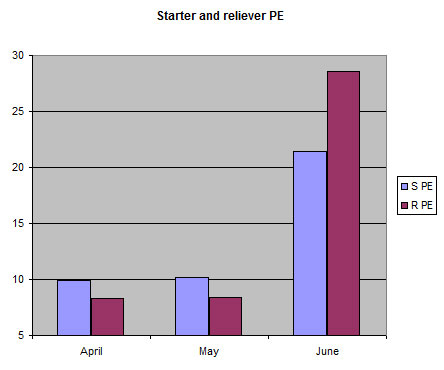
I would argue that looking at PE, supports the empirical opinion that:
The 2008 MLB average PE for starters was 9.19 and for relievers 10.89. So the rotation has been pretty average as a unit but the pen below average. The July numbers are phenomenal: 21.45 for the rotation and 28.57 for the bullpen. To give some points of reference, in 2008 Roy Oswalt had a PE of 21.19 and Brad Lidge a PE of 25.61. Not bad.
The next plot would try to kill two birds with one stone: Why are the pen ERA and WHIP in April so misleading and is July sustainable? ERA is not a great measure of pitching ability, but one would think that WHIP will be able to describe what is going one pretty well. Apparently not so and here is the reason:
Here is the Twins' starters and reliever's BABIP month by month:

BABIP is batting average on balls in play (excludes home runs, HBP, K and BB). It should normalize at about .290 to .300. In April the Twins pitchers had a higher than normal BABIP (reflected in the higher that expected WHIP) and in May a lower than normal BABIP (reflected in the lower than expected WHIP).
The good news is that both the rotation and pen BABIP have been stable at close to normal levels so I expect the success to continue. One might argue that Swarzak was a big part of this change in June. However, looking at individual PEs Swarzak's year to day is 7.94 and Perkins' (excluding last nights game) 8.22, thus, I suspect that it will not matter that much.
Whose numbers are inflated and whose are deflated based on PE? Here are the individual PEs (ranked high to low) for the Twins pitchers:
Starters
Baker: 34.47
Slowey: 30.80
Liriano: 9.32
Perkins: 8.23
Swarzak: 7.94
Blackburn: 4.61
Relievers
Nathan: 54.79
Guerrier: 26.57
Henn: 14.46
Ayala: 13.41
Dickey: 7.84
Mijares: 7.81
Breslow: 4.50
Crain: 3.70
Surprised? Baker is close to breaking through (and his last 2-3 starts indicate that) and Blackburn is living on the edge by giving too many hits, walking more batters than usual and striking out fewer than usual. Also, Mijares, mainly because his occasional lack of command that results to a high numbers of walks (the same problem that Breslow and Crain had, but in lesser degree than those two), might be walking on thin ice. On the other hand, Guerrier has been exceptional, Henn surprising and Ayala has been pitching better than his "traditional numbers" indicate.


