Here is the way it is calculated (again, one needs a box-score and a calculator:)
Start with 0 points (unlike the pitching Game Score that starts with 50)
Add 1 point for each Run, RBI, 2B, SB, BB, and HBP recorded.
Add 2.5 for each hit, 3 for each 3B and 4 for each HR.
Subtract 1 for each CS and GIDP,
subtract 1 for each error,
for catchers add 1 for each CS
Subtract 0.2 for each SO and 0.5 for each AB.
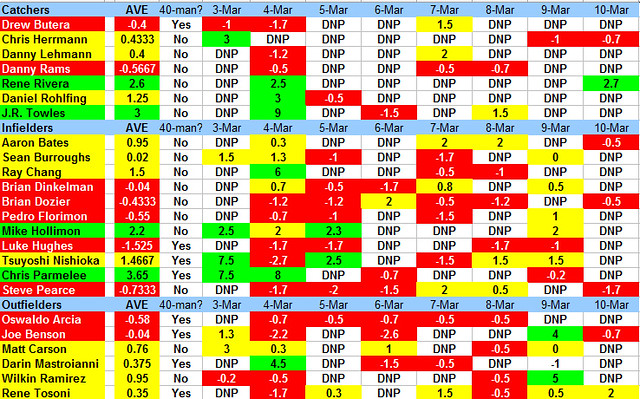
Again, as in the Bullpen Battle Dashboard, the Bench Battle Dashboard is color coded based on average, above average and below average performances, where:
Average is Batting Game Score between 0 and 2
Above average is Batting Game Score higher than 2
Below average is Batting Game Score less than 0
Also the Dashboard, is broken down by catchers, infielders and outfielders
One comment before I present the Bench Battle Dashboard: Before Spring Training, I thought that Luke Hughes was a lock. However, based on his continuous below average performances (actually the worse by any position player in the team), I think that his position might be in jeopardy, so I am tracking his performance as well:
Here is what the Dashboard looks like after today's game against the Pirates:

And the rankings by position:
Catchers:
J.R. Towles 3
Rene Rivera 2.6
-----
Daniel Rohlfing 1.25
Chris Herrmann 0.433333333
Danny Lehmann 0.4
----
Drew Butera -0.4
Danny Rams -0.566666667
Infielders:
Chris Parmelee 3.65
Mike Hollimon 2.2
----
Ray Chang 1.5
Tsuyoshi Nishioka 1.466666667
Aaron Bates 0.95
Sean Burroughs 0.02
----
Brian Dinkelman -0.04
Brian Dozier -0.433333333
Pedro Florimon -0.55
Steve Pearce -0.733333333
Luke Hughes -1.525
Outfielders:
----
Wilkin Ramirez 0.95
Matt Carson 0.76
Darin Mastroianni 0.375
Rene Tosoni 0.35
----
Oswaldo Arcia -0.58
Joe Benson -0.04
I will be updating this daily and posting updates here close to daily. As always you can find all Spring Training coverage at The Tenth Inning Stretch here.


