Showing posts with label money. Show all posts

2/26/09

Twins and Money. Part 3: How do the Twins' get to $100-125 million player payroll

This is the last and the final segment in this series. In the first segment I examined whether the Twins' player payroll spending is out of line from that of the rest of the teams in the major leagues, compared to their revenue stream. The conclusion was that it was not. In the second segment, I examined whether the Twins are getting as much revenue from their market, based on their revenue and their market's personal income, introducing the term "market revenue capture" to reflect the ability of a team to extract revenue from its market, and the conclusion was that the Twins' revenue capture was below league average. In addition, looking at the revenue capture of two other division rivals (in smaller markets than the Twins), I concluded that if the Twins capture revenue at the rate of the Kansas City Royals and spend the league average on player payroll, they could afford a player payroll of $95.7 million and if the Twins capture revenue at the rate of the Cleveland Indians and spend the league average on player payroll, they could afford a player payroll of $127.3 million. Both of these scenarios would not only not cause any financial hardship to the Twins, but, it turn, it would allow them to increase their profits.

Usually companies pay management consultants a couple of cool million to have this kind of analysis, but consider this my present to Jim Pohlad for his inaugural season as the managing owner of the Twins, and I hope he puts that extra couple of million towards the payroll :)

This segment would deal with how the Twins can capture more market revenue.

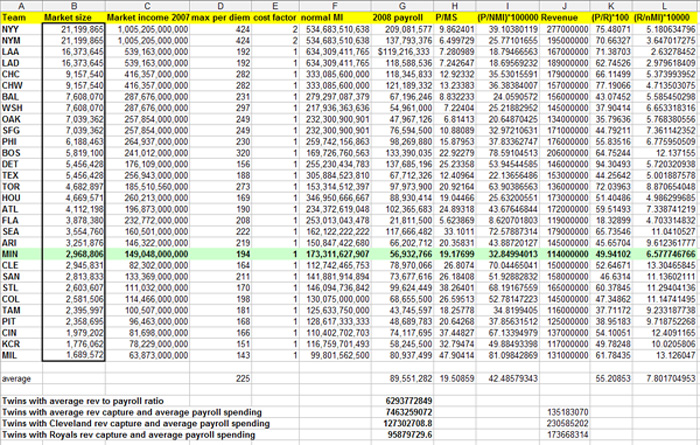
As a reminder, the market revenue capture (i.e how much money goes to a major league team for every $10,000 made in its market) for an average league team is 7.80, for the Twins is 6.58, for the Royals 10.02 and for the Indians a league leading 13.30.

Here are how the Twins can pull this off (and there are well into their way, believe me):

The first 2 steps are easy:

a. Keep fielding a competitive team:

This might be a no-brainer, but here is the data (and lets look at the year 2010, which will be the year after which a lot of Twins' players are about to hit some serious paydays) :


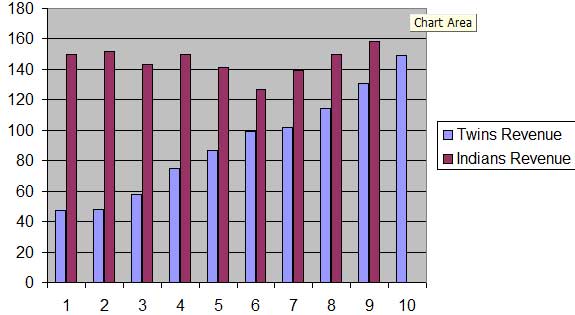
This graph compares the Twins' and Indians' (remember, they are kind of the holy grail keepers of revenue capture in the bigs) revenue in the last 10 years. Year 10 is 2008 (no data for the Indians). The numbers are from Forbes and you can find the Twins' numbers here and the Indian's here. As you can see, when the Twins became competitive, their revenue increased dramatically. A revenue that was flat in 1999 (the first year) and 2000 (year 2) increased dramatically every year, but 2005 (when the Twins were not competitive). The average increase in the years from 2003 on (I am leaving 2001 and 2002 off because the revenue jumped 20.1% and 29.3% respectively from the previous years; and this is an unsustainable pace because the Twins became from about to be contracted to division champions. I am also leaving 2005 off because they were not competitive.) was 14%. If they sustain this by being competitive and winning something, the 2009 revenue will be $161 million and the 2010 revenue will be $183.5 million. That would mean that at 2010, the Twins will jump ahead of Royals with a 10.59 revenue capture, which will allow them a $100.1 million player payroll without any hardship. It is that easy... they just have to say competitive.

b. Get the stadium going

This part is even easier than the first part, because the new stadium is well in its way. What would the revenue impact of a new stadium be? Here is a nice, technical article that looks at the impact of a new stadium in attendance and determined that in the first season, a new park could realize an attendance boost of 758,308 fans. Given that the average Twins' fan spends about $100 in the park (in the dome nevertheless), even if the number is closer to 500,000 more fans, we are looking at an additional $50 million of revenue for 2010, the first season of Target field. That would boost the above number of total potential revenue to $233.5 million, which will result to a 13.47 revenue capture (Indians territory), which would allow for a $127 million player payroll, without any hardship.

Here you have it. But this is not the whole story. There are a couple more things in play that need to be accounted for:

The economic situation. Believe it or not, this has already been accounted for. By using the 2007 data for the Twins' Market area income, to calculate revenue capture in 2009 and 2010, I assume that the Market area income will stay at 2007 levels the next 2 years (which, since income increased in 2008) is a very pessimistic scenario. But here is the biggie:

League Revenue. By ralizing more revenue and spending more in player salaries, the Twins will probably not have to pay a luxury tax, but some part of revenue sharing will decrease. How do they off-set that? Here is how (and not to underestimate the fact that the Twins will be having some money coming in from the naming rights to their stadium that hasn't been accounted here and could be worth up to $8 million a year for 25 years:

c. Expand the horizons

The Twins' need to think more than their Minnesota and Dakotas, "Twins' Territory" and try to capture more than those markets.

For starters one thing that 90% of the Twins' fans are not aware, is that the franchise is one of the original 8 1901 American league founding franchises. If the Boston Red Sox can embrace the Boston Americans' history, the Oakland Athletics, the Philadelphia Athletics' history, the Cleveland Indians the Cleveland Blues' history, the Twins should embrace the Washington Senator's history, forget about the bitter divorce of the Griffith's with the Capital City, once in a while wear throw back uniforms with W's on them and hang pictures of Walter Johnson, Goose Goslin, Sam Rice, Joe Cronin, Bucky Harris and Heinie Manush along those of Oliva, Kirby, Hrbek and Killebrew on the Target Field concourses or where their new monument park will be. Just think of the merchandise sales.

There are several states both in the upper Midwest and Northwest that are not covered by the Twins' radio and television programming, which are ripe for picking: Iowa, Nebraska, Wyoming, Montana, Utah, even parts of Wisconsin are ripe for picking. It will not take what Ted Turner did (creating a national station that televised for free all of his team's games), but the Twins can market the TV and Radio rights aggressively to stations in these markets that have no programming and whose residents would not mind listening to or watching a following a baseball team in the summer. Here is the current Twins' radio network map. Pretty limited. Also, why not target the areas of current minor league Twins' franchises?

The Twins got to build goodwill with the community. Last year the average attendance in the dome was 25000 people. That means that about 20000 tickets in every game remained unclaimed. A very simple solution will be to give away 50% of their unclaimed tickets to disadvantaged families and kids. Just give them away. Not only that would bring more people in the park to cheer the team and set the Twins as a great corporate citizen, but will bring in revenue (as in parking and concessions) to their coffers.

Their you got it. This is the plan for the Twins becoming a perennial contender with a $125+ million payroll, generating sufficient profit and paying back the community.

Eat your hearts out Yankees.

What do you think? Feel free to commend here or email me at thetenthinningstretch at gmail.com

2/24/09

Twins and Money. Part 2: How high could the Twins payroll go?

Yesterday I examined the relationship of the Twins' player salary payroll to their income, and compared it with what other teams in the league are spending. The conclusion is that the Twins were slightly below league average last year (they will be about league average this year.) Also, in the process of doing this, it was shown that the Detroit Tigers and Chicago White Sox are spending an exuberant amount of their revenue towards players salary, which suggests that fire sales of sorts and periods of non-contention might be looming in the very near future of these clubs.

The Twins have a lot of good young players, several of whom are at the league minimum or close to it. In a few years the Twins might be faced with tough decisions about keeping some of these players. How far could the Twins' payroll stretch, so they will be able to pay and keep their young talent (when it makes sense). I am trying to answer this question today.

back to the spreadsheet:


again:

Column A is the teams, column B is the "market size" (data from here; I am not using this value for any calculations; it is there just for reference and the teams are ranked according to that. This is the number of people who live in those metropolitan areas. Column C is the total market's personal income (i.e. how much money all the people in the Twin Cities metropolitan area make). Column D is the maximum allowable per diem the US government allows for the different metropolitan areas. This is used as an indicator of cost of living in the MLB markets. Column E is the ratio of the cost of living in a single market to the average, based on per diems (for some reason excel displayed that in one significant figure, but the calculations were done correctly, as you can see). I call this the "cost factor". Column F is the normalized market income, which is the market income in column C divided by the cost factor in column E. This should be a representation of what the whole market area has to spent, if the living expenses were equal among all markets. Column G is the total player salary payroll in 2008 (all figures are in USD, btw). Ignore column H, I am not using it. Column I is the total payroll as a fraction of the total income in the market area (multiplied by 100000 so the numbers are easier to look at). This could be used as one way to compare spending among teams (but I am not doing it; it would really over-complicate things). Column J is each team's revenue in 2006, as indicated above. Column K is the percent revenue spent on player payroll. This is the measure that I am using to compare how much different teams are spending on players.

The last column (L) is the team revenue divided by the total market income and multiplied by 10,000 (so the numbers are prettier to look). I call this the "market revenue capture". If I were a bit smarter when I created the spreadsheet I would had multiplied by 50,000 to give a rough estimate of how much of an American's (or Canadian's) family income is spent as a revenue to their home MLB team (you can do this mental exercise at home. The numbers suggest that every family in the MLB metropolitan areas, contributes an average of about $39 a year to its local MLB team's revenues.) Here are all the MLB teams ranked by market revenue capture (in italics are teams in multi-team markets) :


Indians 13.30
Brewers 13.13
Reds 12.41
Red Sox 12.14
Cardinals 11.29
Rockies 11.15
Padres 11.13
Seattle 11.04
Royals 10.02
Diamondbacks 9.61
Pirates 9.72
Rays 9.23
Toronto 8.87
MLB AVERAGE 7.80
Giants 7.36
Braves 7.34
Phillies 6.77
Nationals 6.65
Athletics 5.76
Twins 6.58
Detroit 5.72
Orioles 5.59
Cubs 5.37
Yankees 5.18
Rangers 5.00
Astros 4.99
White Sox 4.71
Marlins 4.70
Mets 3.65
Dodgers 2.98
Angels 2.63

The bottom line is that the Twins do not capture as much revenue as they could from the Twin Cities market. They are capturing revenue at slightly higher rated than the teams that have to compete with other teams in their market and less than the average MLB team. This is not very good.

The projections, of how high the Twins payroll could be (without compromising or overtaxing the organization more than any other team in the market, which is a good business practice), are in the bottom of the spreadsheet:

If the Twins were spending in player salaries what the average team spends as a percentage of their revenue, they would spend $62.9 million (a number very close to their 2009 payroll)

If the Twins were capturing market revenue at the rate the average major league team captures market revenue and spend in player salaries what the average team spends as a percentage of their revenue, they could spend $74.6 million (a number very close to their 2007 payroll)

If the Twins were capturing market revenue at the rate the Kansas City Royals (a team much less successful on the field than the Twins) capture market revenue and spend in player salaries what the average team spends as a percentage of their revenue, they could spend $95.9 million

If the Twins were capturing market revenue at the rate the Cleveland Indians (the leader in revenue capture in the majors) capture market revenue and spend in player salaries what the average team spends as a percentage of their revenue, they could spend $127.3 million in player salaries, without any problem.

Clearly, those two last numbers would:

  • Make every Twins' fan (who has not been following the team in its glory years when its payroll was on the higher echelons of the league) do silly uncontrolled gestures of happiness

  • Have a strong basis for the team not to worry about picking and choosing who of its deserved players who are due for bigger contracts to keep and who to release (see: Ortiz, David)

  • In combination with prudent spending (i.e. Do not do what Detroit does or what the Yankees do throwing away money at old underperforming players), could build a dynasty in the Twins Cities


Too good to be true?

Nah, piece of cake. The next (and final) piece in this series will deal with how it can happen (and it does not really take much, just lessons learned, thinking outside the box and having fun)


Stay tuned...
(to be continued)

2/23/09

Twins and Money. Part 1: Are the Twins "cheap"?

This is the first in 3 article series dealing with the overall subject of Twins and Money. In this first segment, I will be examining, whether the Twins are "cheaper" compared to the rest of the league, in the second segment I will be examining how high potentially the payroll could be stretched and in the last, how could the Twins get there. I know it is not baseball, like balls and strikes and homeruns and stolen bases, but it is essential for baseball.

The Twins' fans (or at least a sizable part of them) have the perception that the Twins (most accurately the Twins' ownership) are not willing to spend "what it takes". A google search with the keywords "cheap" and "Pohlad", returns 15500 pages (and in a lot of them several select adjectives and participles modify "cheap".) A lot of fans will never forget that Pohlad was willing to contract the team, including me. Also, a lot of fans, including me, are appreciative for the money that Pohlad spent compared to the Griffiths, which resulted in two World Championships for this team in 4 years. Letting bygones be bygones, here is what I did (and numbers for baseball are hard to find so everything is a very good approximation) :

I collected the following data:

  • Total Personal Income in the baseball marketplaces for 2008, from the Bureau of Economic Analysis, US Department of Commerce and from The City of Toronto (for 2006)

  • To calculate the cost of living in each of those metropolitan areas and to normalize the personal income according the cost of living (the thought here is that if you make $75K a year and your mortgage costs $1000 a month in KC vs $2200 a month in NYC, you probably have more money to spent in baseball in KC), I used the per diem allowances of the US government for travel to different places for 2009

  • The most recent revenues I could find (and these are kept in more secrecy than the Vatican Archives)were from a Forbes article for 2006

  • Finally, I used 2008 payroll figures from Cot's Baseball Contracts


here is what the data looks like:


For the purpose of this, please ignore everything underneath the main table; it will be discussed in the next article of the series.

Column A is the teams, column B is the "market size" (data from here; I am not using this value for any calculations; it is there just for reference. Column C is the total market's personal income as discussed above (i.e. how much money all the people in the Twin Cities metropolitan area make). Column D is the maximum allowable per diem the US government allows for the different metropolitan areas, as indicated above. This is used as an indicator of cost of living in the MLB markets. Column E is the ratio of the cost of living in a single market to the average, based on per diems (for some reason excel displayed that in one significant figure, but the calculations were done correctly, as you can see). I call this the "cost factor". Column F is the normalized market income, which is the market income in column C divided by the cost factor in column E. This should be a representation of what the whole market area has to spent, if the living expenses were equal among all markets. Column G is the total player salary payroll in 2008 (all figures are in USD, btw). Ignore column H, I am not using it. Column I is the total payroll as a fraction of the total income in the market area (multiplied by 100000 so the numbers are easier to look at). This could be used as one way to compare spending among teams (but I am not doing it, explanation on the next piece). Column J is each team's revenue in 2006, as indicated above. Column K is the percent revenue spent on player payroll. This is the measure that I am using to compare how much different teams are spending on players. I'll discuss the last column (L) in the next article, so ignore it for now.

Big Caveats as far as assumptions go (and yes they were done because of limitations, mainly lack of access to a supercomputer that could do regressions, but this is not supposed to be an academic paper ) :

  • I am using only the main markets here (i.e. a lot of North Dakota, South Dakota and Iowa residents attend Twins games, but only the Twins Cities metropolitan area is accounted

  • In multi-team markets, I assume that the whole market is accessible to both teams equally

  • In some markets (like Cincinnati), other than College sports, major league baseball is the only game in town and that should probably drive up revenues, but I have no way to account for that, esp. looking at things like NASCAR and whatnot


An average team spends 55.21% of its revenue in player salaries.

The five biggest spenders:

Detroit 94.30
White Sox 77.19
Yankees 75.48
Dodgers 71.39
Mets 70.66

The five thriftier spenders:

Marlins 18.34
Oakland 35.80
Rays 37.71
Nationals 37.90
Pittsburgh 38.95

Team Average:
Philies 55.84, while the MLB average is 55.21

The Twins are spending 49.94 percent (using the 2008 payroll). This will get closer to league average for 2009, since a lot of teams decreased their payroll and the Twins increased theirs.

I would not call the Twins "cheap". That said, I strongly believe that the Twins are not capturing as much revenue as they can from the market and should have the opportunity to capture more, which in turn will allow them to pay more for players (and make more money) without any hardship.

One interesting piece of this data is that Detroit and the White Sox are overspending teams like the Yankees, the Dodgers and the Red Sox at this point. They are already cutting their payroll, but in the near future expect more cuts, especially in this economic climate. Their overspending cannot be sustained and I expect some years of fire sales and non-competing for both of them (this is good for the Twins)

The next part would be looking at market revenue capture and what the Twins could afford as a player salary payroll if they capture their market revenue at the level of some of their peer teams, and the last part will be looking at what would it actually take for the Twins to capture that revenue.

(to be continued...)