
The Twins' fans (or at least a sizable part of them) have the perception that the Twins (most accurately the Twins' ownership) are not willing to spend "what it takes". A google search with the keywords "cheap" and "Pohlad", returns 15500 pages (and in a lot of them several select adjectives and participles modify "cheap".) A lot of fans will never forget that Pohlad was willing to contract the team, including me. Also, a lot of fans, including me, are appreciative for the money that Pohlad spent compared to the Griffiths, which resulted in two World Championships for this team in 4 years. Letting bygones be bygones, here is what I did (and numbers for baseball are hard to find so everything is a very good approximation) :
I collected the following data:
- Total Personal Income in the baseball marketplaces for 2008, from the Bureau of Economic Analysis, US Department of Commerce and from The City of Toronto (for 2006)
- To calculate the cost of living in each of those metropolitan areas and to normalize the personal income according the cost of living (the thought here is that if you make $75K a year and your mortgage costs $1000 a month in KC vs $2200 a month in NYC, you probably have more money to spent in baseball in KC), I used the per diem allowances of the US government for travel to different places for 2009
- The most recent revenues I could find (and these are kept in more secrecy than the Vatican Archives)were from a Forbes article for 2006
- Finally, I used 2008 payroll figures from Cot's Baseball Contracts
here is what the data looks like:
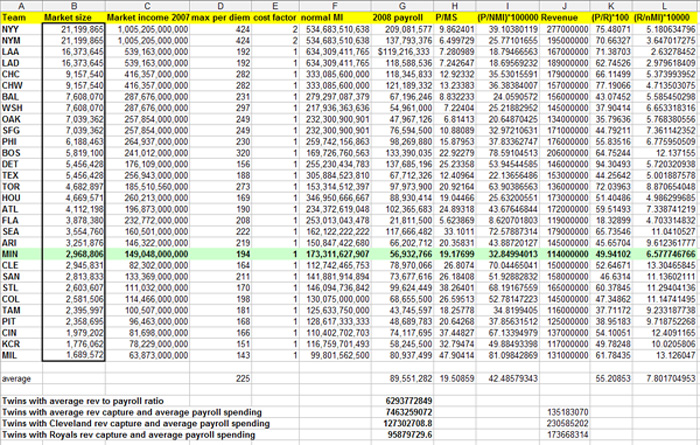
For the purpose of this, please ignore everything underneath the main table; it will be discussed in the next article of the series.
Column A is the teams, column B is the "market size" (data from here; I am not using this value for any calculations; it is there just for reference. Column C is the total market's personal income as discussed above (i.e. how much money all the people in the Twin Cities metropolitan area make). Column D is the maximum allowable per diem the US government allows for the different metropolitan areas, as indicated above. This is used as an indicator of cost of living in the MLB markets. Column E is the ratio of the cost of living in a single market to the average, based on per diems (for some reason excel displayed that in one significant figure, but the calculations were done correctly, as you can see). I call this the "cost factor". Column F is the normalized market income, which is the market income in column C divided by the cost factor in column E. This should be a representation of what the whole market area has to spent, if the living expenses were equal among all markets. Column G is the total player salary payroll in 2008 (all figures are in USD, btw). Ignore column H, I am not using it. Column I is the total payroll as a fraction of the total income in the market area (multiplied by 100000 so the numbers are easier to look at). This could be used as one way to compare spending among teams (but I am not doing it, explanation on the next piece). Column J is each team's revenue in 2006, as indicated above. Column K is the percent revenue spent on player payroll. This is the measure that I am using to compare how much different teams are spending on players. I'll discuss the last column (L) in the next article, so ignore it for now.
Big Caveats as far as assumptions go (and yes they were done because of limitations, mainly lack of access to a supercomputer that could do regressions, but this is not supposed to be an academic paper ) :
- I am using only the main markets here (i.e. a lot of North Dakota, South Dakota and Iowa residents attend Twins games, but only the Twins Cities metropolitan area is accounted
- In multi-team markets, I assume that the whole market is accessible to both teams equally
- In some markets (like Cincinnati), other than College sports, major league baseball is the only game in town and that should probably drive up revenues, but I have no way to account for that, esp. looking at things like NASCAR and whatnot
An average team spends 55.21% of its revenue in player salaries.
The five biggest spenders:
Detroit 94.30
White Sox 77.19
Yankees 75.48
Dodgers 71.39
Mets 70.66
The five thriftier spenders:
Marlins 18.34
Oakland 35.80
Rays 37.71
Nationals 37.90
Pittsburgh 38.95
Team Average:
Philies 55.84, while the MLB average is 55.21
The Twins are spending 49.94 percent (using the 2008 payroll). This will get closer to league average for 2009, since a lot of teams decreased their payroll and the Twins increased theirs.
I would not call the Twins "cheap". That said, I strongly believe that the Twins are not capturing as much revenue as they can from the market and should have the opportunity to capture more, which in turn will allow them to pay more for players (and make more money) without any hardship.
One interesting piece of this data is that Detroit and the White Sox are overspending teams like the Yankees, the Dodgers and the Red Sox at this point. They are already cutting their payroll, but in the near future expect more cuts, especially in this economic climate. Their overspending cannot be sustained and I expect some years of fire sales and non-competing for both of them (this is good for the Twins)
The next part would be looking at market revenue capture and what the Twins could afford as a player salary payroll if they capture their market revenue at the level of some of their peer teams, and the last part will be looking at what would it actually take for the Twins to capture that revenue.
(to be continued...)


No comments:
Post a Comment