
The Twins have a lot of good young players, several of whom are at the league minimum or close to it. In a few years the Twins might be faced with tough decisions about keeping some of these players. How far could the Twins' payroll stretch, so they will be able to pay and keep their young talent (when it makes sense). I am trying to answer this question today.
back to the spreadsheet:
again:
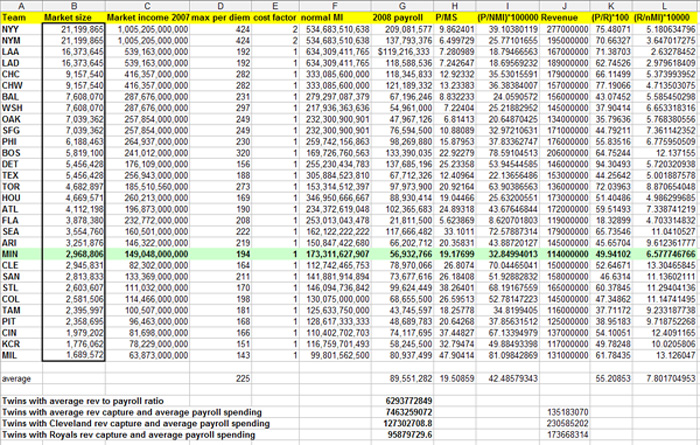
Column A is the teams, column B is the "market size" (data from here; I am not using this value for any calculations; it is there just for reference and the teams are ranked according to that. This is the number of people who live in those metropolitan areas. Column C is the total market's personal income (i.e. how much money all the people in the Twin Cities metropolitan area make). Column D is the maximum allowable per diem the US government allows for the different metropolitan areas. This is used as an indicator of cost of living in the MLB markets. Column E is the ratio of the cost of living in a single market to the average, based on per diems (for some reason excel displayed that in one significant figure, but the calculations were done correctly, as you can see). I call this the "cost factor". Column F is the normalized market income, which is the market income in column C divided by the cost factor in column E. This should be a representation of what the whole market area has to spent, if the living expenses were equal among all markets. Column G is the total player salary payroll in 2008 (all figures are in USD, btw). Ignore column H, I am not using it. Column I is the total payroll as a fraction of the total income in the market area (multiplied by 100000 so the numbers are easier to look at). This could be used as one way to compare spending among teams (but I am not doing it; it would really over-complicate things). Column J is each team's revenue in 2006, as indicated above. Column K is the percent revenue spent on player payroll. This is the measure that I am using to compare how much different teams are spending on players.
The last column (L) is the team revenue divided by the total market income and multiplied by 10,000 (so the numbers are prettier to look). I call this the "market revenue capture". If I were a bit smarter when I created the spreadsheet I would had multiplied by 50,000 to give a rough estimate of how much of an American's (or Canadian's) family income is spent as a revenue to their home MLB team (you can do this mental exercise at home. The numbers suggest that every family in the MLB metropolitan areas, contributes an average of about $39 a year to its local MLB team's revenues.) Here are all the MLB teams ranked by market revenue capture (in italics are teams in multi-team markets) :
Indians 13.30
Brewers 13.13
Reds 12.41
Red Sox 12.14
Cardinals 11.29
Rockies 11.15
Padres 11.13
Seattle 11.04
Royals 10.02
Diamondbacks 9.61
Pirates 9.72
Rays 9.23
Toronto 8.87
MLB AVERAGE 7.80
Giants 7.36
Braves 7.34
Phillies 6.77
Nationals 6.65
Athletics 5.76
Twins 6.58
Detroit 5.72
Orioles 5.59
Cubs 5.37
Yankees 5.18
Rangers 5.00
Astros 4.99
White Sox 4.71
Marlins 4.70
Mets 3.65
Dodgers 2.98
Angels 2.63
The bottom line is that the Twins do not capture as much revenue as they could from the Twin Cities market. They are capturing revenue at slightly higher rated than the teams that have to compete with other teams in their market and less than the average MLB team. This is not very good.
The projections, of how high the Twins payroll could be (without compromising or overtaxing the organization more than any other team in the market, which is a good business practice), are in the bottom of the spreadsheet:
If the Twins were spending in player salaries what the average team spends as a percentage of their revenue, they would spend $62.9 million (a number very close to their 2009 payroll)
If the Twins were capturing market revenue at the rate the average major league team captures market revenue and spend in player salaries what the average team spends as a percentage of their revenue, they could spend $74.6 million (a number very close to their 2007 payroll)
If the Twins were capturing market revenue at the rate the Kansas City Royals (a team much less successful on the field than the Twins) capture market revenue and spend in player salaries what the average team spends as a percentage of their revenue, they could spend $95.9 million
If the Twins were capturing market revenue at the rate the Cleveland Indians (the leader in revenue capture in the majors) capture market revenue and spend in player salaries what the average team spends as a percentage of their revenue, they could spend $127.3 million in player salaries, without any problem.
Clearly, those two last numbers would:
- Make every Twins' fan (who has not been following the team in its glory years when its payroll was on the higher echelons of the league) do silly uncontrolled gestures of happiness
- Have a strong basis for the team not to worry about picking and choosing who of its deserved players who are due for bigger contracts to keep and who to release (see: Ortiz, David)
- In combination with prudent spending (i.e. Do not do what Detroit does or what the Yankees do throwing away money at old underperforming players), could build a dynasty in the Twins Cities
Too good to be true?
Nah, piece of cake. The next (and final) piece in this series will deal with how it can happen (and it does not really take much, just lessons learned, thinking outside the box and having fun)
Stay tuned...
(to be continued)


2 comments:
Make every Twins' fan ... do silly uncontrolled gestures of happiness
Count me as one of those!
Here's hoping that the new stadium drives up attendance and revenue.
The stadium is one thing, but if you look at some teams like Detroit that got a new stadium, their revenue capture is not all that great.
Post a Comment