
Keep in mind that before last season started I used different methodologies to predict that the Twins will win 89 games in 2008, amidst wild speculation from the 'experts' that they will finish 4th or 5th and barely crack 70 wins. Also, using game by game arguments, I predicted that Detroit will win a maximum of 79 games in 2008, while everyone else had them sweeping their way to the World Series. After much ridicule upon publication of these things last spring, I can now just say, “I told you so. And numbers do not lie if you know how to take advantage of them and use them correctly.”
But enough self-patting on the back. Self-induced high-fives look a lot like clapping and cannot clap when Tampa Bay instead of the Twins is playing today in the World Series.
That was then, this is now and there will be more game-to-game predictions coming next spring after the roster is settled, but I wanted to device a statistical way that would allow me to a. see what makes these Twins win (i.e. The Gardenhire era Twins) and b. what effect certain moves have on the Twins W-L record.
It is generally accepted that W-L record is related to the run differential of a team. Heck, Bill James devised his Pythagorean Wins Expectation formula based on Runs Scores (RS) and Runs Allowed (RA), and who the hell am I to doubt the word of the baseball statistics God? Nah, I am not doubting Bill James, but it is all about context (and a warning, from here on this is going to be pretty statistically intense, so if you want the bottom line skip at the end of the post.) One cannot predict how many games the Twins will win in 2008 and 2009 based on a formula constructed that includes data from the number of games the Babe Ruth- and Lou Gheric-led Yankee teams won in the deadball era. Context is extremely important in Baseball of all sports. Different teams have different philosophies and different practices. Thus, I am just looking at statistical samples of the Twins under Gardenhire, and this is what the quasi-big picture looks like:
Back to English:
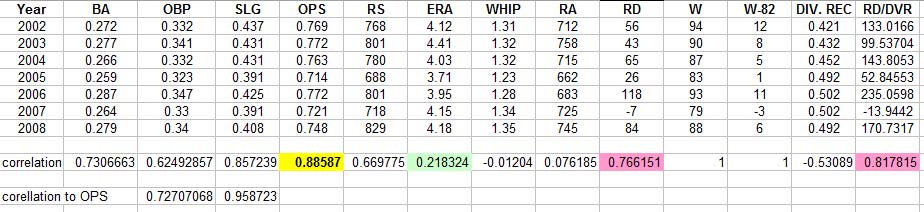
What I did here was to look at several statistical measures (stats) from the Twins from 2002 on (listed as a table year by year) and see how they correlate with the Twins' W-L record that year (Because the Twins had a negative run differential in 2007, I had to correlate that to wins-82 to balance the scales in order for the algebra gods to not give me biased numbers)
What the results show is that the Gardenhine Twins W-L record correlates better (BTW, 1 is perfect correlation) not with ERA (light green/blue box), not with Run Differential (left pink box), even when the RD was normalized for the other teams of the AL Central winning percentage (far right pink box), but it correlated better with team OPS (yellow box).
OPS has two components: OBP and SLG. In the line underneath the year-by-year numbers, I correlated OPS for the Gardy Twins with OBP and SLG. As you can see,for the Gardy years, OPS is very closely correlated to SLG rather than OBP. I am not going to use this fact again (or against anyone other than Billy Bean and he is out of context, anywaya) but the take home lesson is that these Twins succeed when they have a higher slugging percentage (and this was quasi-empirically covered here, albeit in a very dry way.)
Alright... you buy it or not :) this is leading us to potentially formulate a relationship between OPS and wins for the Gardenhire Twins:
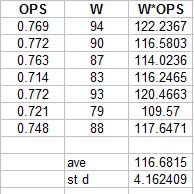
and based on the average and standard deviation, one can formulate an OPS vs. wins chart that would look like that:
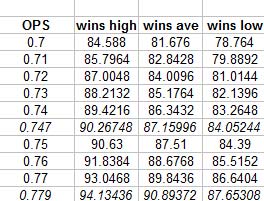
(forget the italics for a moment) This basically allows you to calculate the maximum, average, and minimum wins expected based on a particular team OPS.
Aright. We got our formula, let's put in into play:
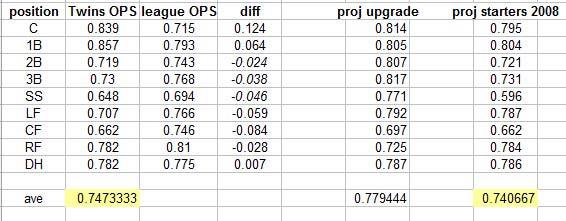
This figure turned up a little more complex than I wanted it (heck, I can't help it), so please ignore columns 3 and 4 (league OPS and diff). Column 1 is the field positions. Column 2 is their OPS. The column titled projected update is the projected OPS numbers of the Twins lineup with the proposed changes in the previous post. The projected OPS values I used are the projected PECOTA OPS values for the proposed Twins' lineup. To see whether that makes any sense, I had to do the control showing the projections of the 2008 starters column (far right), where I used the PECOTA projections for the 2008 Twins starters to predict team OPS. Using that, the Twins' team OPS was predicted to be .741 which is very close to the actual .747 and that makes me a bit more confident about the use of PECOTA projections for 2009.
So, the bottom line is (go to the previous table and look at the italics): with the proposed changes the Twins should win 4 more games than 2008.
Methinks that 92 games will lead the Twins to win the AL Central in 2009.
PS. I'd love to correlate the stat of your choice with the Twins' wins if you don't see it above. Just drop a comment and I'll make it happen...


3 comments:
Thry - Far be it from me to pretend I know or use stats like you do. I do have an observation, though.
The Twins won the division is 2002, '03, '04 & '06. In none of those years did they lead the division in OPS. In '04 the 3rd place team had the highest OPS & in '06 the 3rd & 4th place teams tied for the lead in OPS.
Can you shed some light on this for me? Is it impacted by the Twins emphasis on defense/pitching? Is there such an emphasis?
Also, I posted in this old entry to avoid looking like I was picking a fight. You bring a lot of value to the blog sites. Thank you
thank you. I don't see discussing stuff and disagreeing as picking fights. That's what discourse is all about :)
I am not sure why OPS is the thing that correlates the best with the Twins winning games. I think that there is a baseline of pitching that helps them and that baseline has been fairly high this decade, so OPS is what gets them on top.
That raises some interesting ideas. Perhaps another team, depending on how they are built, might see their records fluctuate with SLG, OBP or some other stat...
Thanks
Post a Comment