
Today the Twins announced 8 cuts from the major league Spring Training camp.
The following players were optioned to AAA Rochester:
C Eric Fryer
LHP Kris Johnson
SS Danny Santana
And the following were re-assigned to the minor league camp:
IF James Beresford
LHP Sean Gilmartin
OF Darin Mastroianni
OF Jermaine Mitchell
3B/1B Brandon Waring
The Santana and Johnson cuts are pretty surprising because they were doing pretty well. Santana was probably the best position player at the camp and Pedro Florimon could not get the ball out of the cage in batting practice a couple days ago. It might be good news for Eduardo Escobar. However, I find it surprising that Doug Bernier, who has been barely average and Jason Bartlett who has been awful, are still in camp. Kris Johnson's performance was the best of a lefty in the bubble so far, and his cut is also interesting at this point, given the fact that Aaron Thompson (not to mention Scott Diamond) is still in camp. Maybe they want to stretch him for starting in AAA.
These cuts leave the Twins with 20 pitchers and 20 position players, which means that 15 more need to be cut before opening day.
A reminder of the scoring system:
And here for the pitchers:
I am heading to Hammond Stadium soon, where the Twins meet Kevin Slowey and the Florida Marlins.
The following players were optioned to AAA Rochester:
C Eric Fryer
LHP Kris Johnson
SS Danny Santana
And the following were re-assigned to the minor league camp:
IF James Beresford
LHP Sean Gilmartin
OF Darin Mastroianni
OF Jermaine Mitchell
3B/1B Brandon Waring
The Santana and Johnson cuts are pretty surprising because they were doing pretty well. Santana was probably the best position player at the camp and Pedro Florimon could not get the ball out of the cage in batting practice a couple days ago. It might be good news for Eduardo Escobar. However, I find it surprising that Doug Bernier, who has been barely average and Jason Bartlett who has been awful, are still in camp. Kris Johnson's performance was the best of a lefty in the bubble so far, and his cut is also interesting at this point, given the fact that Aaron Thompson (not to mention Scott Diamond) is still in camp. Maybe they want to stretch him for starting in AAA.
These cuts leave the Twins with 20 pitchers and 20 position players, which means that 15 more need to be cut before opening day.
Here are the newest Spring Training Dashboards reflecting last night's game, including the players who were cut:
(You can find all of the 2014 Spring Training dashboards here) :
A reminder of the scoring system:
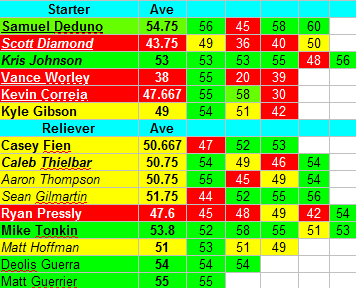
For the pitchers, I quantify using a measurement created by Bill James more than a decade ago called "Game Score". It is calculated as follows:
You start with 50 points for each pitcher.
Add 1 point for each out.
Add 1 point for each strikeout.
Subtract 2 points for each hit.
Subtract 4 points for each earned run.
Subtract 2 points for each unearned run.
Subtract 1 point for each walk.
There is a point bonus for pitching more than 4 innings as well, adding 2 points for each IP after the 4th, but this is not too applicable here.
Game Scored of 49-51 are "average" (yellow),
everything higher than 51 "above average" (green),
and everything below 49 "below average" (red).
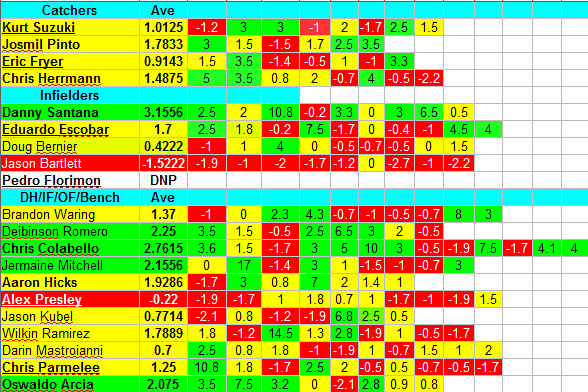
For position players, I devised a similar metric that goes like this:
Start with 0 points (unlike the pitching Game Score that starts with 50)
Add 1 point for each Run, RBI, 2B, SB, BB, and HBP recorded.
Add 2.5 for each hit, 3 for each 3B and 4 for each HR.
Subtract 1 for each CS and GIDP,
subtract 1 for each error,
for catchers add 1 for each CS
Subtract 0.2 for each SO and 0.5 for each AB.
Again, as in the Pitching Battle Dashboard, the Position Player Battle Dashboard is color-coded based on average, above average and below average performances, where:
Average is Batting Game Score between 0 and 2
Above average is Batting Game Score higher than 2
Below average is Batting Game Score less than 0
Players on the 40-man roster are in bold. The ones without options are also underlined. Left-handed pitchers are in italics.
Here is the Dashboard for the Twins' position players:
And here for the pitchers:
I am heading to Hammond Stadium soon, where the Twins meet Kevin Slowey and the Florida Marlins.


No comments:
Post a Comment