
Here are the latest Twins Spring Training battle dashboards updated for yesterday's game and the Spring Training cuts. The players who were cut are not longer listed. You can find all of the 2014 Spring Training dashboards here) :
A reminder of the scoring system:

A reminder of the scoring system:
For the pitchers, I quantify using a measurement created by Bill James more than a decade ago called "Game Score". It is calculated as follows:
You start with 50 points for each pitcher.
Add 1 point for each out.
Add 1 point for each strikeout.
Subtract 2 points for each hit.
Subtract 4 points for each earned run.
Subtract 2 points for each unearned run.
Subtract 1 point for each walk.
There is a point bonus for pitching more than 4 innings as well, adding 2 points for each IP after the 4th, but this is not too applicable here.
Game Scored of 49-51 are "average" (yellow),
everything higher than 51 "above average" (green),
and everything below 49 "below average" (red).
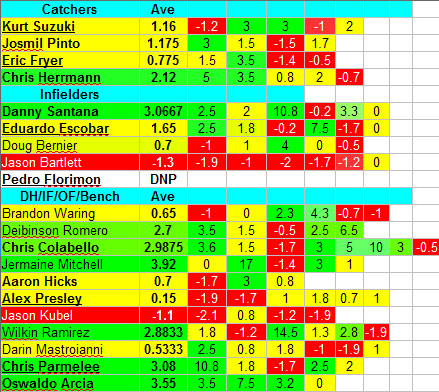
For position players, I devised a similar metric that goes like this:
Start with 0 points (unlike the pitching Game Score that starts with 50)
Add 1 point for each Run, RBI, 2B, SB, BB, and HBP recorded.
Add 2.5 for each hit, 3 for each 3B and 4 for each HR.
Subtract 1 for each CS and GIDP,
subtract 1 for each error,
for catchers add 1 for each CS
Subtract 0.2 for each SO and 0.5 for each AB.
Again, as in the Pitching Battle Dashboard, the Position Player Battle Dashboard is color-coded based on average, above average and below average performances, where:
Average is Batting Game Score between 0 and 2
Above average is Batting Game Score higher than 2
Below average is Batting Game Score less than 0
Players on the 40-man roster are in bold. The ones without options are also underlined. Left-handed pitchers are in italics.
Here is the Dashboard for the Twins' position players:
And for the Pitchers:


No comments:
Post a Comment