
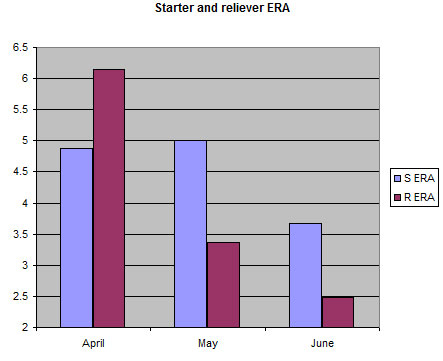
Here is the Twins' starters and reliever's ERA month by month:
Here is the Twins' starters and reliever's WHIP month by month:
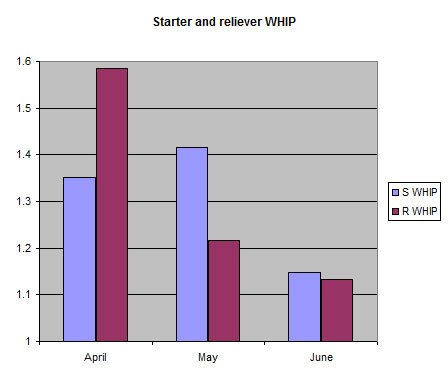
This looks a bit surprising. Yes the starters were pretty bad in April and May, but it looks, using traditional measurements, that the pen had turned the corner in May before becoming really good in June. Sub 3.50 ERA and WHIP around 1.250 is pretty good? Isn't it? That surely conflicts with the empirical observation that the pen was not that great in May. Who is to believe? Your eyes or the numbers? That bullpen surely surrendered leads in May.
As I explained last November there are just not many good measurements to describe and evaluate the state of pitching, and this is why I created the "Pitching Efficiency" measurement (PE= (K/9*K/BB)/WHIP).
Here is the Twins' starters and reliever's PE month by month:
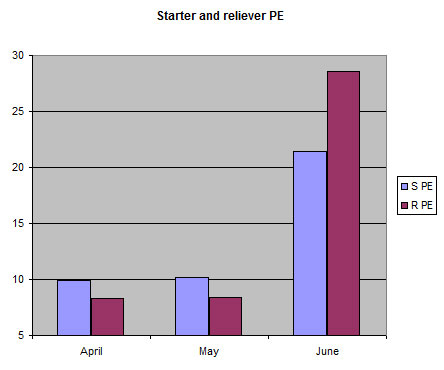
I would argue that looking at PE, supports the empirical opinion that:
The 2008 MLB average PE for starters was 9.19 and for relievers 10.89. So the rotation has been pretty average as a unit but the pen below average. The July numbers are phenomenal: 21.45 for the rotation and 28.57 for the bullpen. To give some points of reference, in 2008 Roy Oswalt had a PE of 21.19 and Brad Lidge a PE of 25.61. Not bad.
The next plot would try to kill two birds with one stone: Why are the pen ERA and WHIP in April so misleading and is July sustainable? ERA is not a great measure of pitching ability, but one would think that WHIP will be able to describe what is going one pretty well. Apparently not so and here is the reason:
Here is the Twins' starters and reliever's BABIP month by month:
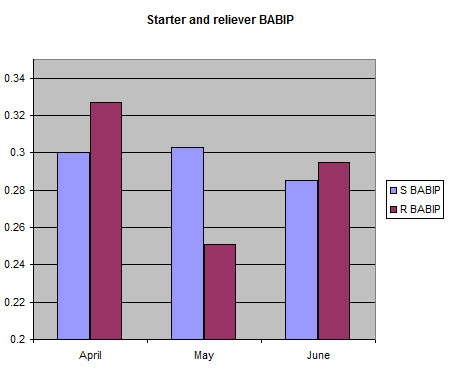
BABIP is batting average on balls in play (excludes home runs, HBP, K and BB). It should normalize at about .290 to .300. In April the Twins pitchers had a higher than normal BABIP (reflected in the higher that expected WHIP) and in May a lower than normal BABIP (reflected in the lower than expected WHIP).
The good news is that both the rotation and pen BABIP have been stable at close to normal levels so I expect the success to continue. One might argue that Swarzak was a big part of this change in June. However, looking at individual PEs Swarzak's year to day is 7.94 and Perkins' (excluding last nights game) 8.22, thus, I suspect that it will not matter that much.
Whose numbers are inflated and whose are deflated based on PE? Here are the individual PEs (ranked high to low) for the Twins pitchers:
Starters
Baker: 34.47
Slowey: 30.80
Liriano: 9.32
Perkins: 8.23
Swarzak: 7.94
Blackburn: 4.61
Relievers
Nathan: 54.79
Guerrier: 26.57
Henn: 14.46
Ayala: 13.41
Dickey: 7.84
Mijares: 7.81
Breslow: 4.50
Crain: 3.70
Surprised? Baker is close to breaking through (and his last 2-3 starts indicate that) and Blackburn is living on the edge by giving too many hits, walking more batters than usual and striking out fewer than usual. Also, Mijares, mainly because his occasional lack of command that results to a high numbers of walks (the same problem that Breslow and Crain had, but in lesser degree than those two), might be walking on thin ice. On the other hand, Guerrier has been exceptional, Henn surprising and Ayala has been pitching better than his "traditional numbers" indicate.


9 comments:
Thry -
I'm just familiarizing myself with advanced pitching metrics. You seem to prefer PE to FIP - any reason? (I'm sure there is.)
Thanks.
White Mamba,
I devised PE mainly because I did not like the following about FIP and xFIP (from that original link up there) :
# They use arbitrary numericals to factor and add to the statistical measurements within their equations (3, 13, 2, 3.2)
# For some strange reason, hits given are not included, but home runs are, factored by a huge 13-times factor
# Bases on balls are factored by 3, strikeouts are factored by 2
# Home runs are based mostly on a hitters capability and the park and not on the pitcher, whereas the defense does not have that much of a role for a hit.
That's why I prefer PE as a measurement of Pinching performance. FIP and xFIP try to describe what one's ERA would have been regardless of fielding... for that they are very good. But I do not think that ERA is a good measure of pitching ability (look at R.A. Dickey's ERA for example)
Hm. I think you've read the wrong stuff concerning FIP/xFIP/tRA/DIPS-in-general. Re: FIP and FIP, those coefficients aren't arbitrary: they're based on multiple regression analysis (correlating the defense independent statistics in question with runs allowed) and then scaled to ERA-like numbers. (It actually seems to me the very definition of "arbitrary" to relate K/9 [even moreso so if that's literaly K/9 and not K/normalized 9 (i.e. K/37-or-so BFs)], K/BB and WHIP in an equation the way PE does.) Hits aren't included in DIPs numbers because major leauge pitchers with any kind of longevity show somewhere between minimal and no long-term ability to suppress hits on balls-in-play (unless they are junk/knuckleballers, who do generate slightly lower oBABIPs), and any slight ability there may be is VERY highly correlated with DIPs numbers, and thereby thus captured by FIP/xFIP. (That's not to say they don't suppress hits: they do so by striking people out, but once the balls in play, it's pretty much a crapshoot mixed with the defense playing behind the pitcher.) xFIP is much preferred by most people to FIP for a reason similar to that which you cite (i.e. "Home runs are based mostly on a hitters capability and the park and not on the pitcher"): pitchers yield flyballs, which hitters turn into home runs. xFIP normalizes the homerun/flyball rate, which takes out the luck since mlb pitchers allow similar hr/fb rates over the long run. The side benefit there is the indirect factoring in of GB rate, since a pitcher who generates lots of groundballs (a repeatable skill with a distribution of ability) will yield less flyballs and hence fewer normalized home runs and, all other things being equal, be worth more wins.
FIP/xFIP actually filter out junk ERA's relying on lucky strand-rates, etc, and properly label mediocre relievers who, for example, are often brought in with runners on but who aren't charged with allowing those runners to score (no effect on ERA), or who've gotten lucky with their hit distribution. You'll presumably be happy to know R.A. Dickey's xFIP is currently sitting at 4.44, while his FIP is even worse. His tRA as a reliever (scaled to ERA) this year is 5.53!! If that don't jibe with the gut, I don't know what does.
None of this is to say that WHIP or your PE or any numbers which include hits don't accurately measure how a pitcher has already performed during a period of time; it's rather to say that those measures do nothing to filter out the luck inherent to that performance and are hence poor descriptors of how much of those results depended on the pitcher's skill and poor predictors of future performance.
The only real problem I have with DIPS is that they inherently fail to capture the Livan Hernandez/AAAA factor: some pitchers in MLB -- almost always not for long -- are NOT throwing at the basic major league quality used in all the research that went into creating DIPs number, and hence ARE throwing glorified batting practice. Basically, at the craptastic extreme, DIPS can make a pitcher look a shade (but only a shade) better than he is, and in those cases WHIP might be pointing something out that the guy's doubtless poor xFIP just doesn't emphasize enough.
Hey, look what's on THT today:
http://www.hardballtimes.com/main/article/how-well-can-we-predict-era/
I'm no statistician, but your PE metric seems to completly overvalue strikeouts and undervalue a pitcher's ability to jam hitters and/or induce weak ground balls. This is likely why Blackburn has such a low PE - he's not a strikeout pitcher, but when he's on he's inducing harmless grounders - despite his excellent performance this year
Toby,
thanks.
those coefficients aren't arbitrary: they're based on multiple regression analysis (correlating the defense independent statistics in question with runs allowed) and then scaled to ERA-like numbers.
I think that the "arbitrary" part comes with their correlation to ERA and "runs allowed". Some of the runs allowed are not 100% percent the responsibility of a particular pitcher. And some of the runs not allowed are a responsibility of a particular pitcher. What do I mean:
Starter leaves the game with runners on first and second one out. He struck out the 2 men he faced in the inning before he gave up 2 singles. Reliever comes in, gives up a triple then get the other batter out without an additional score. The starter will get charged with 2 ER and the reliever with 0. That does not tell how effective these pitcher were in this innings. This is the reason I do not like ERA to be used as a measure of effectiveness. FIP and xFIP are predictive/indicative of what the ERA should "truly" be, so in my book, there are up there with ERA. Runs (and wins) do not mean much. The best pitchers do two things: take the bat off the hands of hitters with strikeouts and do not put men on base by walking them or giving up hits.
Another thing that I vastly disagree with is that home runs are factored that high. Yes a home run really increases someone's ERA, but a lot of times is dependent on other factors (the opponent, the park etc) and not on the pitcher.
About "filtering out luck". I would say that a home run includes more luck than a hit :) That said, PE is biased more towards Ks and BBs (they are included twice each, Ks in K/BB and K/9 and BBs in WHIP and K/BB) than hits that are included once (in WHIP).
Again, my reasoning is not to try to predict ERA (which I think that is not a great measurement), but to find a way to describe pitching performance using simple metrics.
As far as Dickey goes, his PE is below league average and according to that he is the fourth worse reliever on the staff, which is consistent with FIP and xFIP.
Just another way of looking at things, I guess.
Joe,
I agree up to a point. The ability to induce ground outs is taken into consideration in the WHIP component of the PE. BTW, Blackburn's (and Swarzak's for that matter) problem is that he walks too many people. The other thing is if you put the ball to play you are going to give a hit 30% of the time.
Again, MLB pitchers can't (or can barely) suppress hits on balls-in-play over the long run. Given that, what's the point of talking about hits when strikeouts capture the one sure way to suppress them (unless, as I said, one simply want to measure what a player's already done rather than gain an idea of how much of what he did was because of repeatable skills and therefore is predictive, but in that case let's make the DicknBertnGordonGladden case for win-loss record)?
Home runs are valued so highly because that's what their value for run-scoring really is when one runs the regressions. There's not really any plausible statistical argument to make against that value. (See the intro to tRA, for example, which shows the run values of HRs and BBs and Ks in 2008: http://www.statcorner.com/tRAabout.html) And again, every DIPS metric but basic FIP takes the park/hitter/etc. out of the equation by normalizing home runs as a function of flyballs, which is what home runs are from the pitcher's perspective over the longterm. For what it's worth, DIPS 3.0 (the specific statistic, not DIPS stats in general), LIPS and tRA are much measures of true skill than xFIP and FIP, because they're about expected outs and runs based on batted ball types that are fairly controllable from the pitcher's perspective (flyballs, groundballs, infield popus), not actual outs (except strikeouts) and, in some cases, are based on a normalized distribution of events ala BaseRuns (http://en.wikipedia.org/wiki/Base_Runs).
Of course, only xFIP is readily available and updated, so we gotta take what we can get there. I look at K and BB rates per batter faced or per NORMALIZED 9 innings (generally about 37 BFs) in conjunction with xFIP, as xFIP's reliance on actual outs (including batted balls in play converted to outs with all the randomness thereby entailed) as a measure of "time" is certainly a drawback.
ERA is indeed a terrible measurement. The point of these numbers is to produce a good measurement scaled to one with which people are already familiar. The point of making the metrics about runs theoretically allowed given the SKILLS the pitcher has demonstrated is that that's how baseball games are won and lost.
Blackburn's control is a lot worse this year. He's gonna do one of two things as the year goes on: improve his control, strike more people out and continue to post good traditional numbers, or keep pitching the same way and be in for some 10 hit shellacings.
Thanks, thrylos. like I often mention on my blog, I am not one to "get" advanced stats, and I think you might be my new go-to for that. Good work.
Your PE measurement boils down to (K^2 * 9)/(BB^2 + BB*H).
I don't see how this scaling really makes any sense. Squaring Ks and BBs is odd enough. The BB*H term also doesn't pass the gut check. I could potentially see a K/(BB+H) ratio being useful, perhaps with scaling for hits, but this stat doesn't seem to improve upon anything.
I agree with the conclusion, the methodology doesn't add up.
Post a Comment